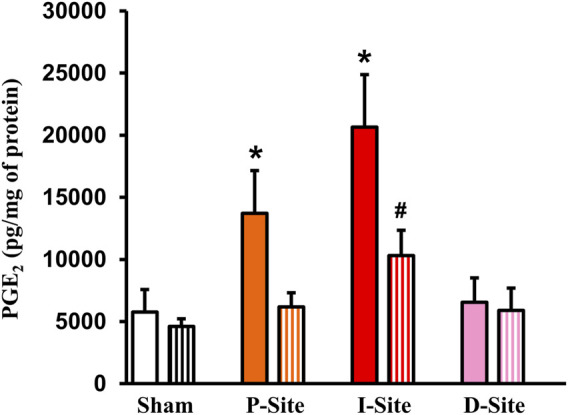
FIGURE 4.

PGE2 levels in sham colon and different colonic sites of Crohn’s-like colitis. Full-thickness colon tissues were taken for the measurements of PGE2. Shown are PGE2 levels in sham and different sites (P, I, and D) of TNBS colitis (day 7) with regular diet (solid bar) and liquid diet treatment (streaked bar). Note: PGE2 levels were significantly increased in site P and I, but not in site D of CD-like rats. Liquid diet treatment blocked PGE2 increase in the P-site. N = 5 or 6. *p < 0.05 vs. sham. #p < 0.05 vs. I-site/regular food.
