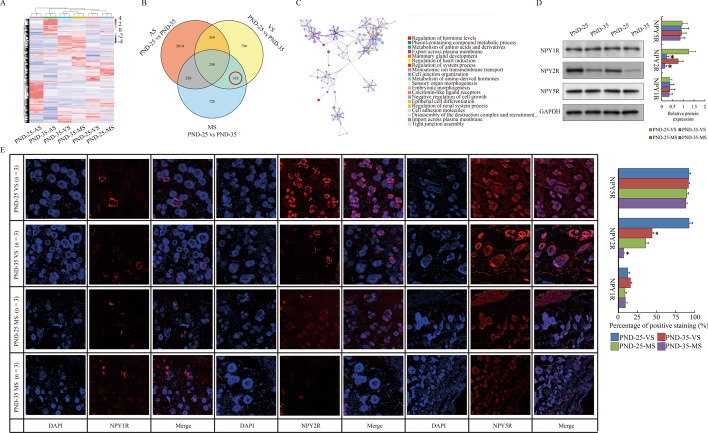
Fig. 2.
Down-regulated NPY2R in pubertal skin. A Heatmap shows the DEGs of MS, VS an AS compared between PND-25 and PND-35. B Venn diagram shows the interested DEGs special for SG compared between PND-25 and PND-35. C Metascape analysis shows the GO and KEGG terms involved in interested DEGs for SG. D Western blot show the expression of NPY receptors in VS and MS of PND-25 and PND-35. E IF show the expression of NPY receptors in VS and MS of PND-25 and PND-35 (magnification with ×200). The SG specimens from two individuals were used for western blot and RNA sequencing. Statistical analysis and abbreviated description can be referred to Fig. 1 legend

