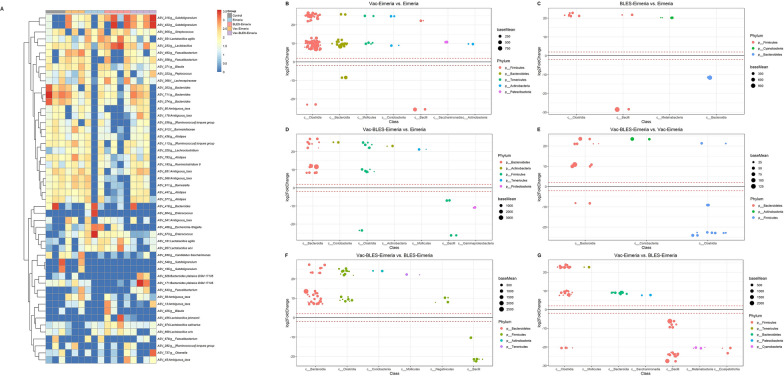
Fig. 5.
Clustering and difference analysis results at the ASV level of each group in challenge experiment. a The top 50 ASVs in terms of relative abundance were selected for cluster analysis, and a pairwise difference analysis was sequentially conducted with plot_taxa_heatmap function in R package microbiomeutilities (v.1.00.16). b–g Different microbial taxa between experimental groups are shown using phyloseq_to_deseq2 and DESeq function in R package phyloseq (v.1.36.0). The log2FoldChange setting is > 2 and the alpha setting is 0.05. In the case of significantly different levels of ASV abundances, classification was completed at the phylum and class levels. ASVs, Amplicon sequence variants

