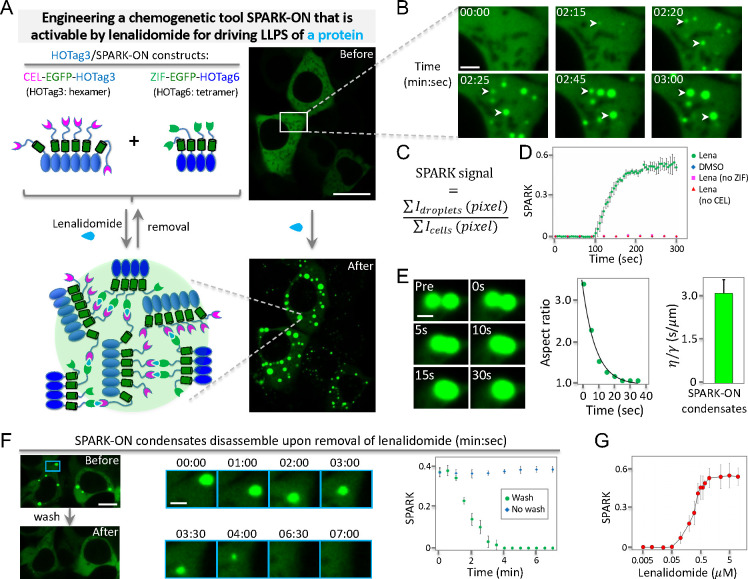
Figure 2.
Engineering a lenalidomide-activatable chemogenetic tool for manipulating protein phase separation. (A) Left: schematic of lenalidomide-activatable chemogenetic tool SPARK-ON for controlling the PS of a protein of interest (POI). POI/SPARK-ON constructs are CEL-EGFP-POI and ZIF-EGFP-HOTag6. Here POI is HOTag3. POI can also be YAP or other proteins. Right: fluorescent images before and after the addition of lenalidomide to HEK293 cells expressing the two constructs shown on the left. (B) Time-lapse images corresponding to the boxed area in (A). (C) Definition of the SPARK signal, which is the ratio of total droplet fluorescence over total cellular fluorescence. The fluorescence intensity of all droplets is summarized from each pixel of droplets. The total cellular fluorescence is summarized from all fluorescent pixels. (D) Quantitative analysis of droplet formation over time after the addition of lenalidomide or DMSO in HEK293 cells expressing HOTag3/SPARK-ON or without CEL or ZIF. The error bar represents the standard deviation (n = 3). (E) Left panel: Time-lapse images showing the fusion events of two condensates in HEK293 cells. Middle panel: Aspect ratio of two fusing droplets over time. Right panel: Inverse capillary velocity averaged from seven fusion events. The error bar represents the standard deviation (n = 7). (F) Time-lapse images showing droplet disassembly after the removal of lenalidomide. HEK293 cells were preincubated with lenalidomide for 10 min. Time-lapse imaging started after lenalidomide removal. Time is in min:sec. The error bar represents the standard deviation (n = 3). (G) Titration curve of the normalized SPARK signal in cells incubated with various concentrations of lenalidomide. The error bar represents the standard deviation (n = 3). Scale bars: (A) 20 μm, (B) 3 μm, (E) 1 μm, (F) 10 μm, and (F) inset: 2 μm.

