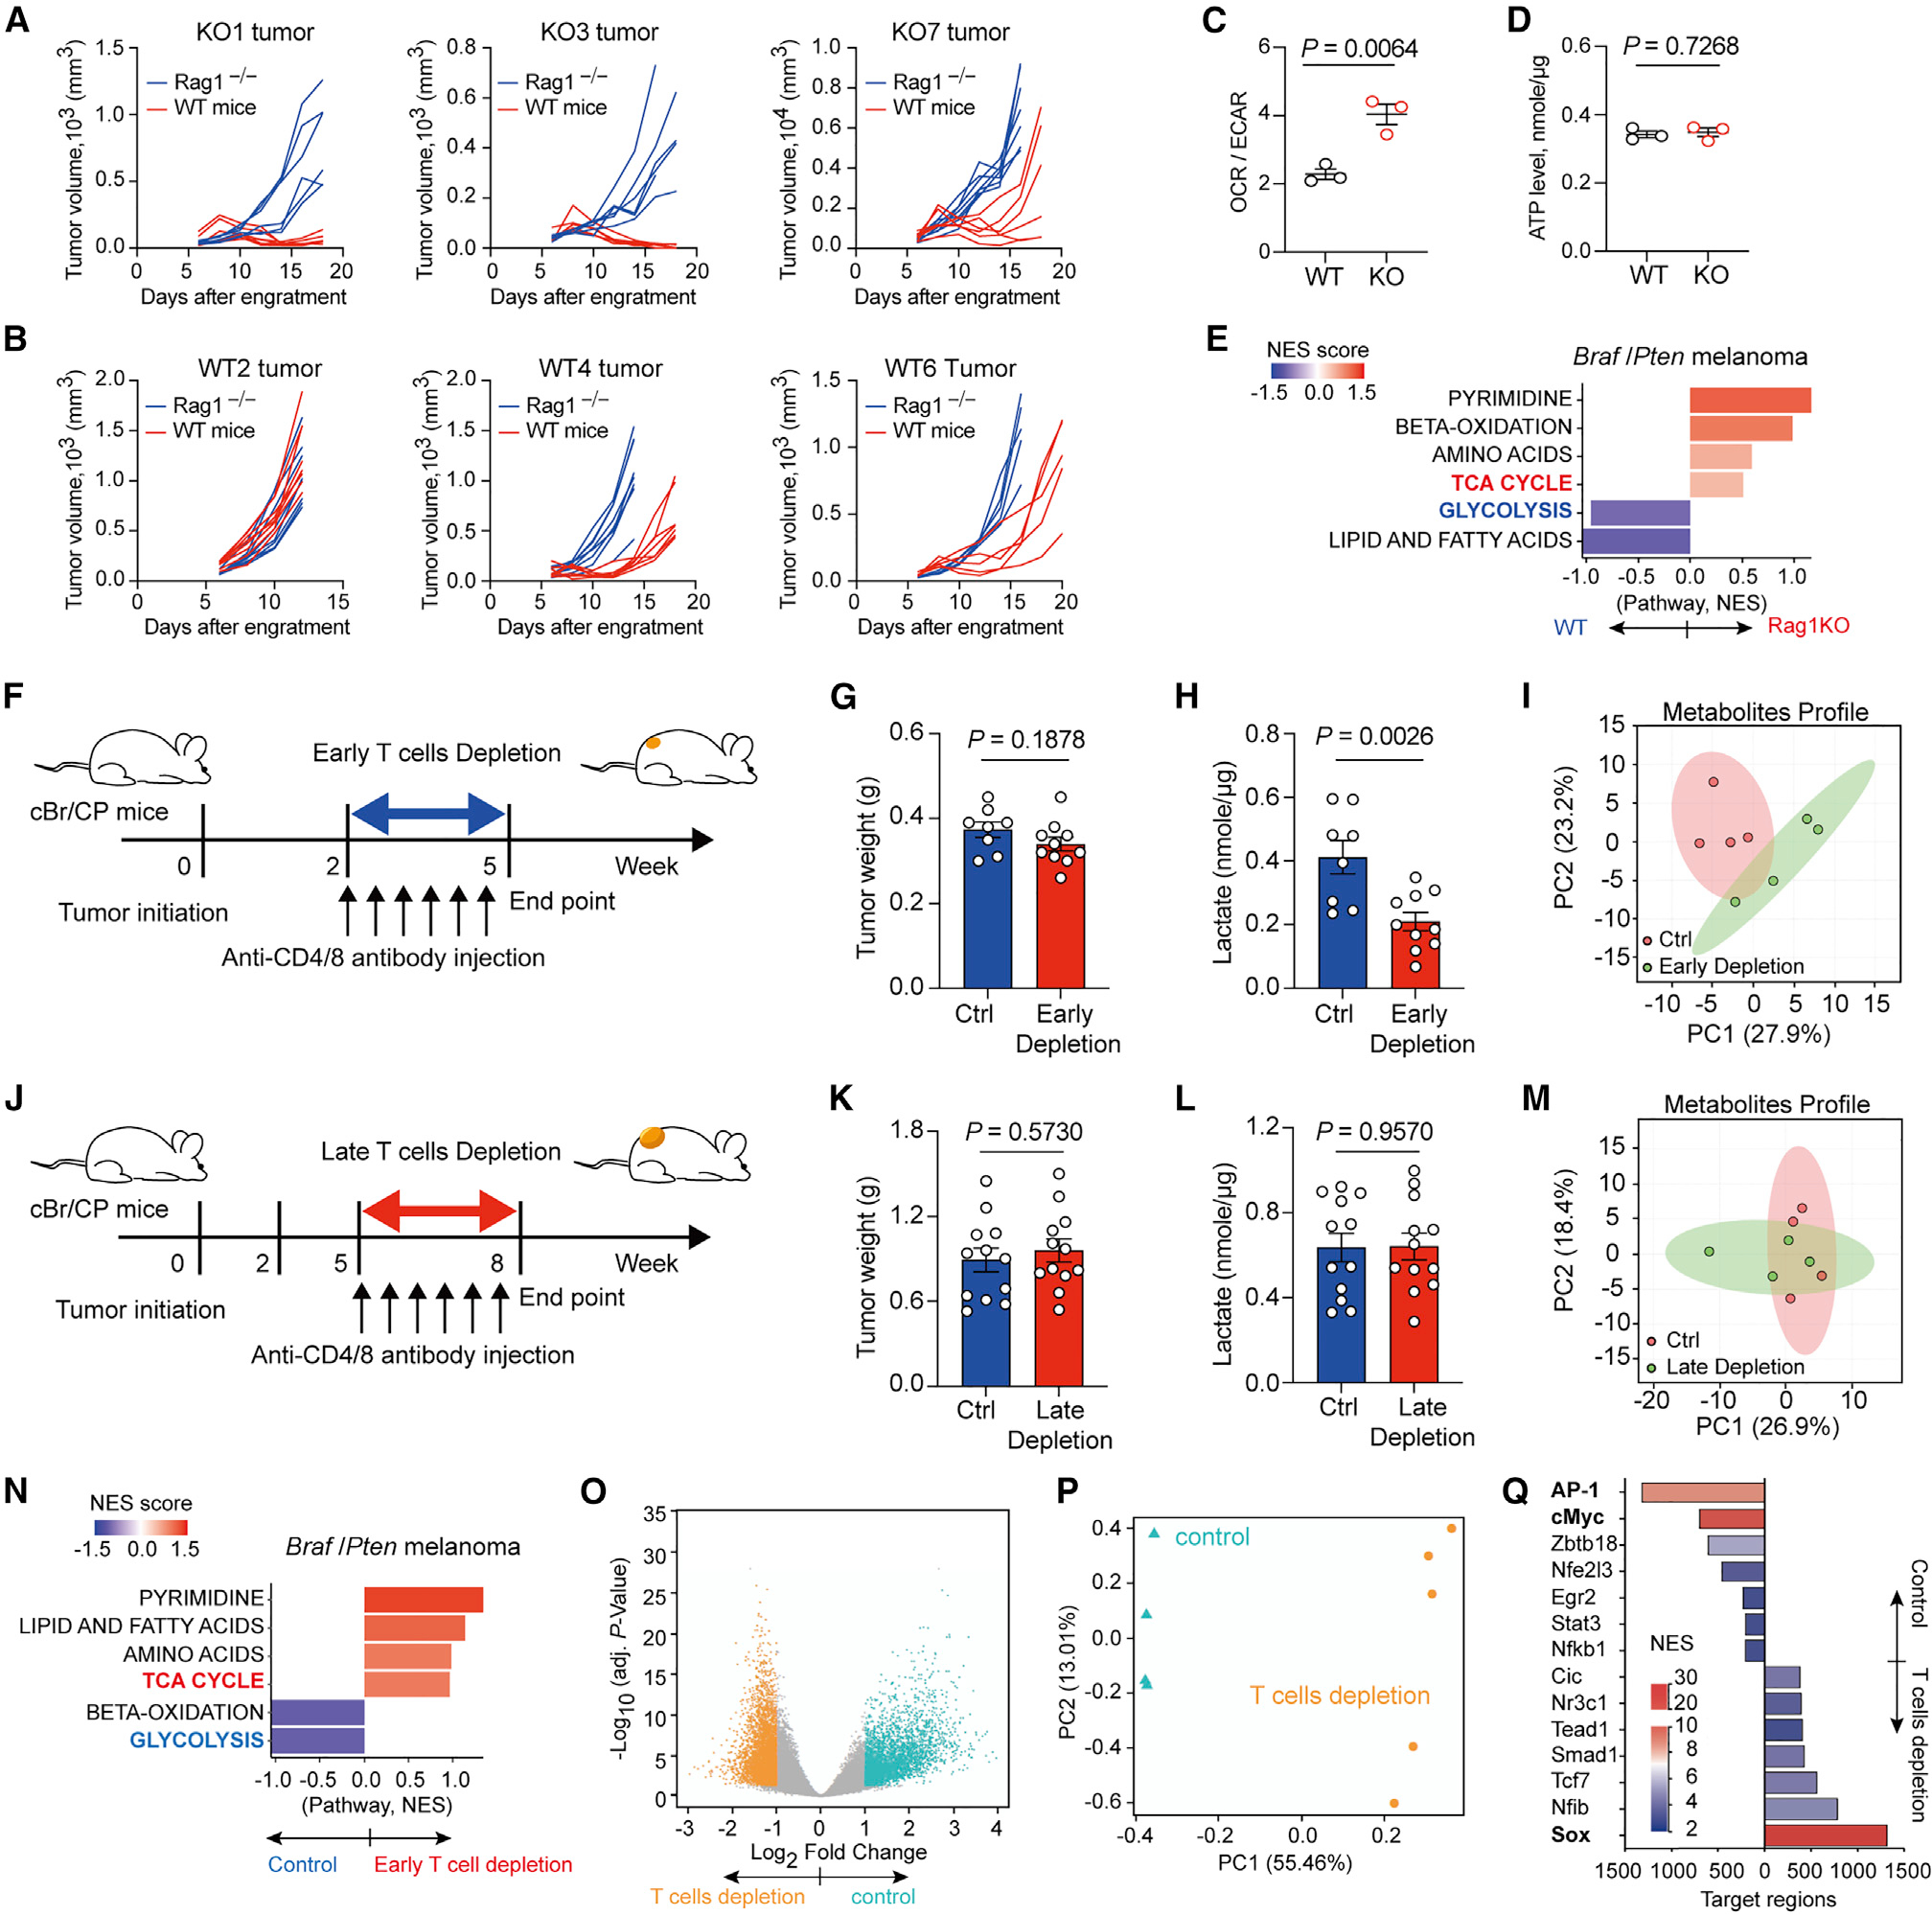
Figure 1. Early-stage T cell-mediated immunosurveillance influences tumor metabolism.

(A) Tumor growth curve for KO1, KO3, and KO7, three Braf/Pten melanoma cell lines derived from adaptive immune cell-deficient Braf/Pten mouse, after subcutaneously engrafting into C57BL/6 wild-type mice and Rag1−/− mice (n = 6–7 per group).
(B) Tumor growth curve for WT2, WT4, and WT6 cell lines derived from immunocompetent Braf/Pten mouse, after subcutaneously engrafting into C57BL/6 wild-type mice and Rag1−/− mice (n = 6–7 per group).
(C and D) Ratios of basal OCR versus ECAR (C) and ATP level (D) of three WT primary melanoma cells and three KO primary melanoma cells.
(E) Metabolite set enrichment analysis of Braf/Pten tumors from immunocompetent wild-type background versus matched Rag1-KO background (bottom panel).
(F) Experimental outline of antibody-based early T cell depletion in murine Braf/Pten melanomas 2 weeks post-tumor induction with 4-hydroxytamoxifen (4-HT).
(G and H) Tumor weight (G) and lactate levels in tumors (H) in Braf/Pten melanomas from control (n = 8–10) and T cell depletion (n = 10) groups.
(I) Principal component analysis (PCA) of metabolites in Braf/Pten tumors from control and early T cell depletion (n = 4 per group).
(J) Experimental scheme of antibody-based late T cell depletion in murine Braf/Pten melanomas 5 weeks post-tumor induction.
(K and L) Tumor weight (K) and lactate levels in tumors (L) in Braf/Pten melanomas from control and late T cell depletion groups (n = 12 per group).
(M) PCA of metabolites in Braf/Pten tumors from control and late T cell depletion (n = 4 per group). (N) Metabolite set enrichment analysis of Braf/Pten tumors from early T cell depletion versus matched control groups.
(O and P) Volcano plot (O) and PCA plot (P) of differentially accessible genomic regions determined by ATAC sequencing in Braf/Pten melanoma cells isolated from Braf/Pten-mTmG mice treated with PBS (control) or early T cell depletion group.
(Q) Enriched transcription factors binding differentially accessible genomic loci in control (Ctrl) or T cell-depleted Braf/Pten melanoma cells.
Data are representative or cumulative results of two independent experiments (A–D, G, H, K, and L). Each symbol represents one individual (G, H, K, and L) or the mean of 5 replicates for each treatment (C and D). Data are mean ± SEM and analyzed by unpaired, two-tailed Student’s t test.
