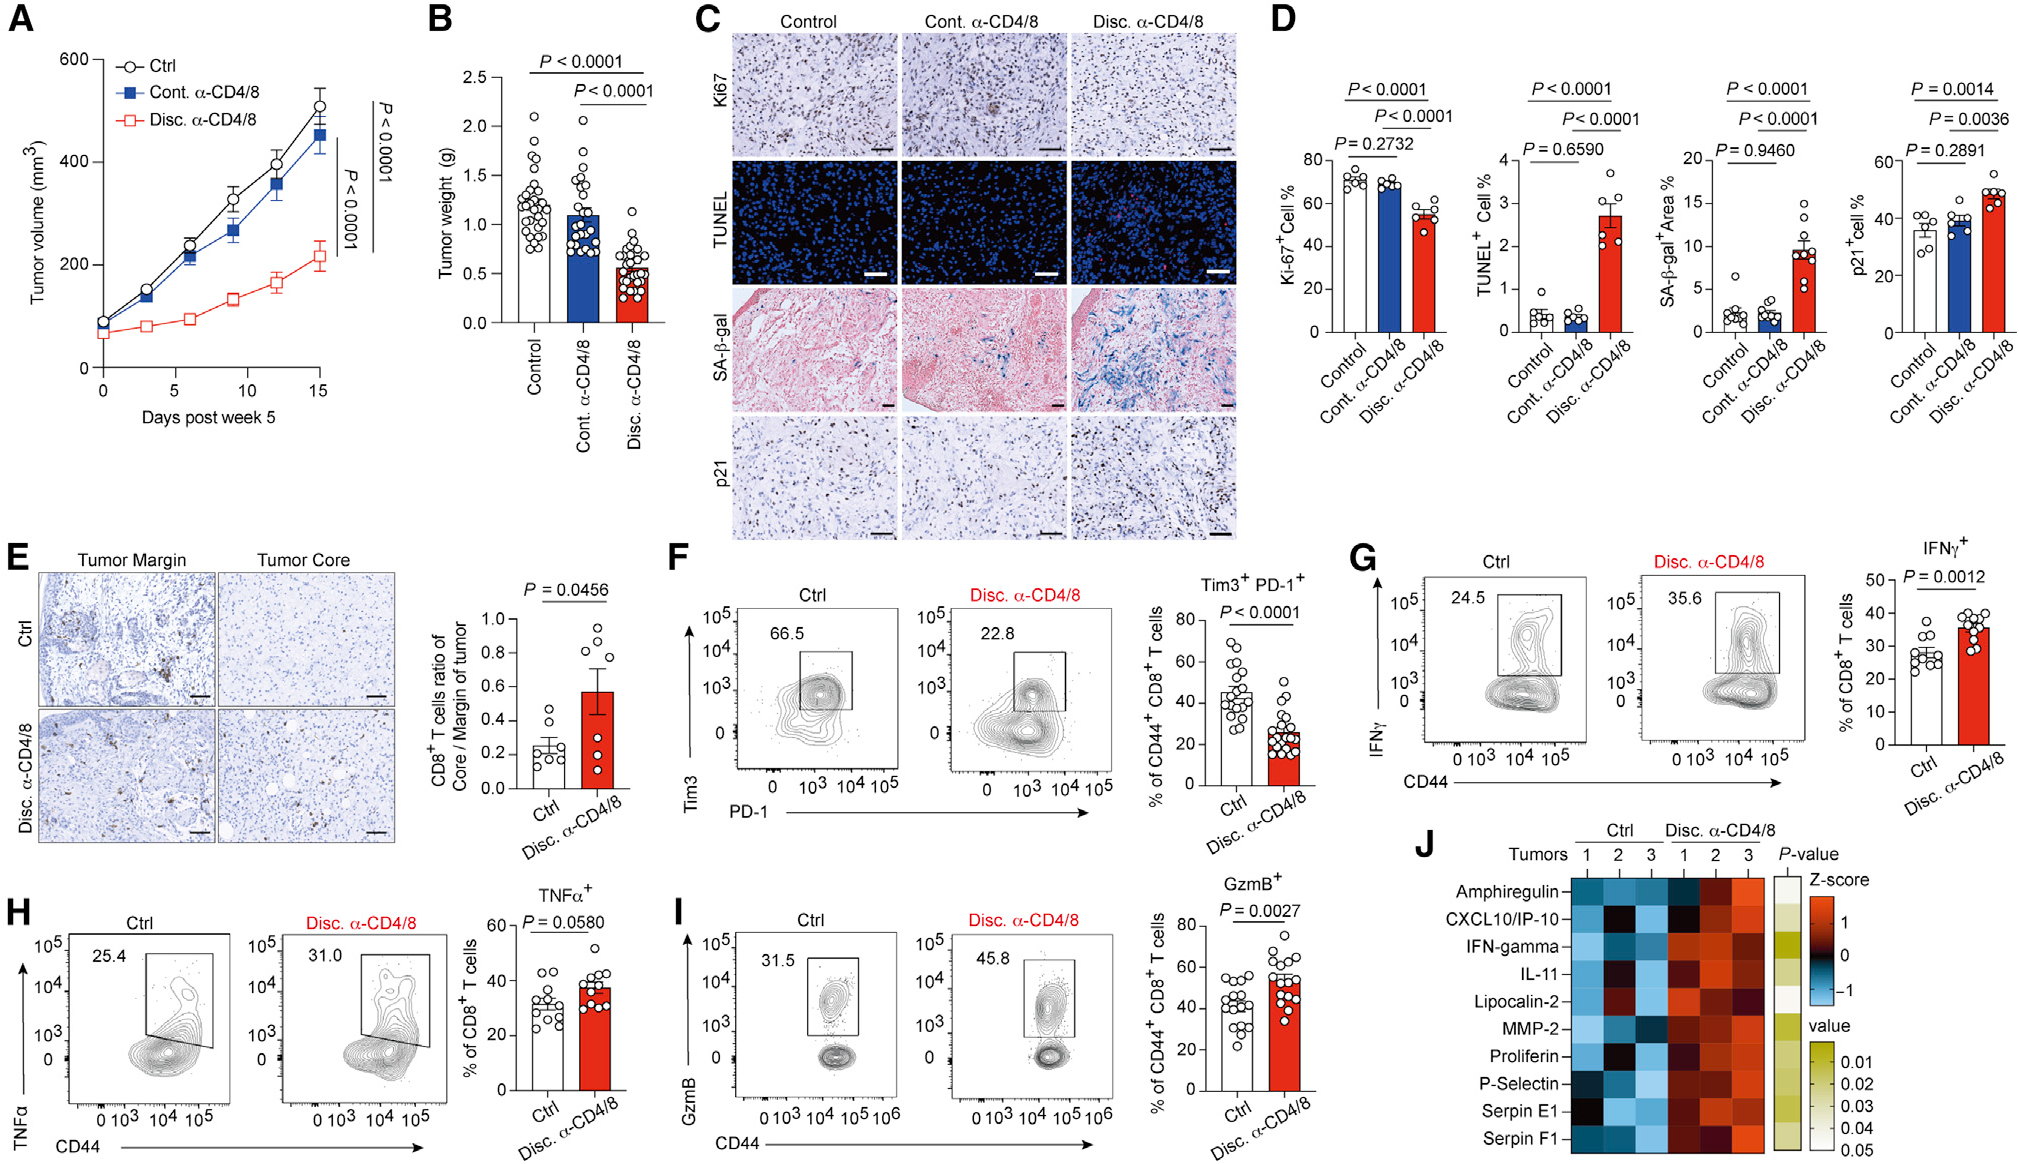
Figure 2. Early-stage immunosurveillance supports melanomas to dampen T cell anti-tumor immunity.

(A and B) Tumor growth (A) and tumor weight (B) of Braf/Pten melanoma tumor from control, continued anti-CD4/8 antibody treatment (Cont. α-CD4/8), or discontinued anti-CD4/8 antibody treatment (Disc. α-CD4/8) groups.
(C) Representative histology images for staining of Ki67, senescence-associated β-galactosidase activity (SA-β-gal), apoptotic cells with TUNEL, and p21 in indicated groups. Slides were counterstained with hematoxylin in chromogenic sections, counterstained with nuclear fast red in β-gal assay, and counterstained with DAPI in immunofluorescence staining. Scale bars, 50 μm.
(D) Quantitative results of IHC staining from indicated markers in indicated groups.
(E) Representative images (left) and quantitative results (right) of CD8+ T cell distribution in the margin region and core region of tumors from indicated Braf/Pten mice.
(F–I) Representative plots and quantitative results of Tim3+ PD-1+ CD8+ tumor-infiltrating T cells (F) and IFNγ-producing (G), TNF-α-producing (H), and granzyme B (GzmB)-producing cells (I) among total tumor-infiltrating CD44+ CD8+ T cells from the indicated mice.
(J) The heatmap of differentially expressed cytokines in tumors from indicated groups (n = 3 per group) determined by cytokine protein array.
Data are the cumulative results from at least two independent experiments (A, B, and F–I). Each symbol represents one individual (B and F–I) or represents the average of positive cell percentage from random 4 field in a section of individual tumor (D and E). Data are means ± SEM and analyzed by two-tailed, unpaired Student’s t test.
