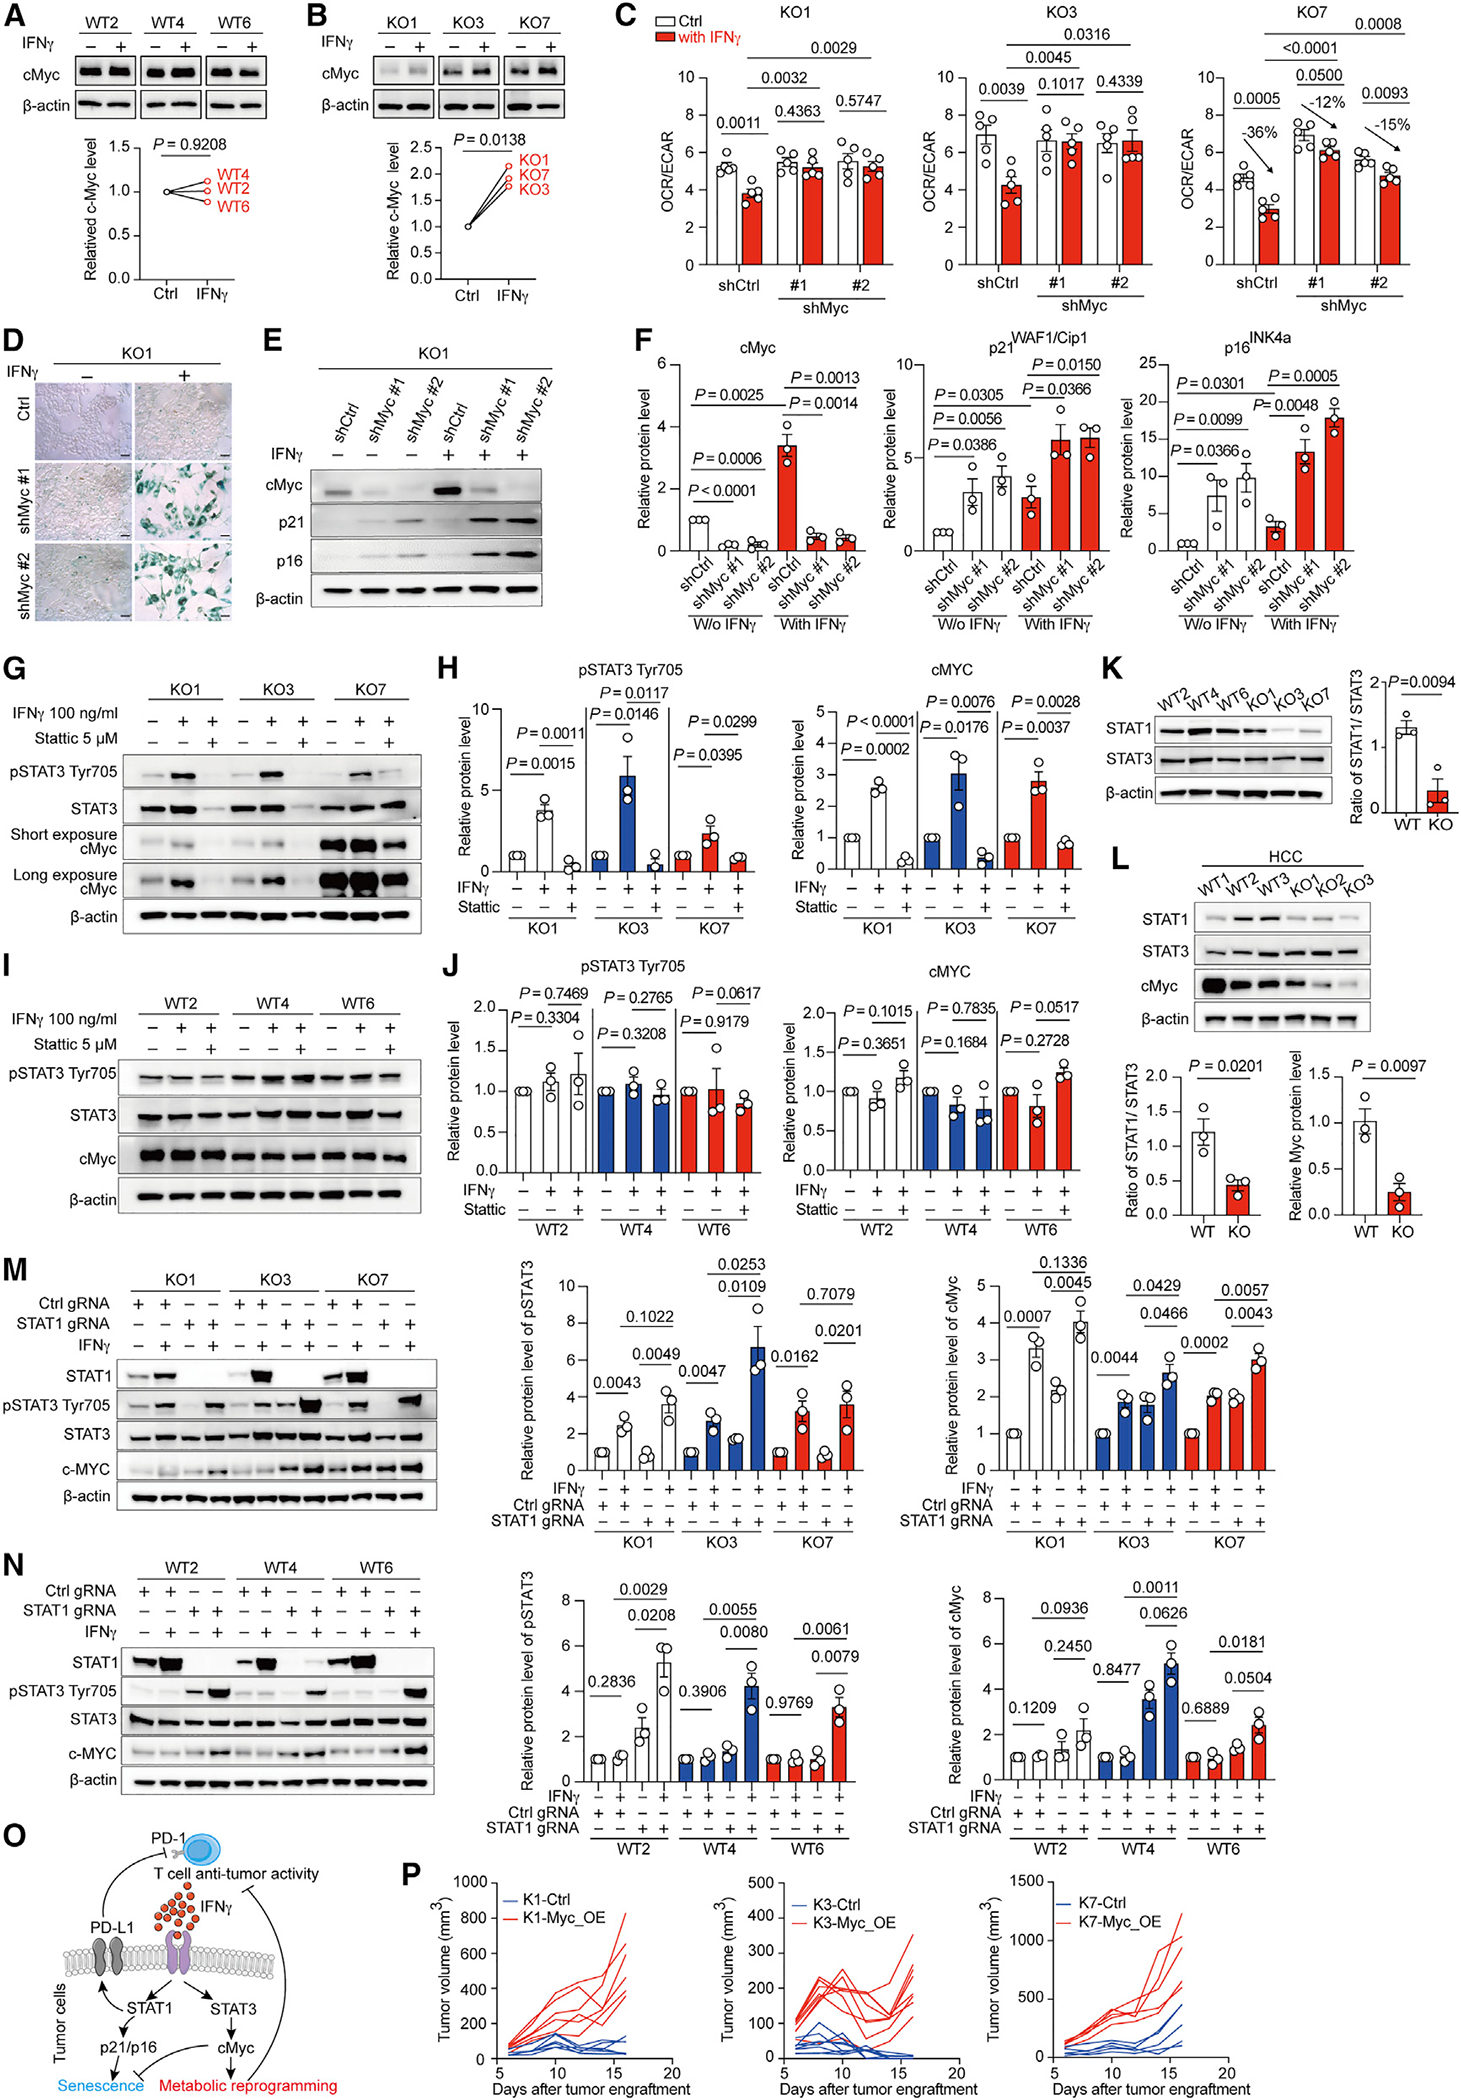
Figure 5. IFNγ-STAT3 signal axis promotes cMyc-dependent metabolic reprogramming and resistance to senescence.

(A and B) Representative immunoblots (upper panel) of cMyc and β-actin and quantitative analysis of cMyc/β-actin ratios in primary WT melanoma cells (A) and KO melanoma cells (B) treated with or without IFNγ for 16 h.
(C) Ratios of basal OCR/EACR in indicated KO cells transfected with short hairpin RNAs targeting scramble sequence (shCtrl) or cMyc sequence (shMyc #1 and shMyc #2). Cells were incubated with or without 100 ng mL−1 IFNγ for 48 h prior to assay.
(D) Represented staining of β-gal activity in KO1 cells transfected with short hairpin RNAs targeting scramble sequence (shCtrl) or cMyc sequence (shMyc #1 and shMyc #2) upon exposure with or without IFNγ for 4 days. Scale bars, 50 μm.
(E and F) Representative immunoblots (E) and quantitative results (F) of indicated proteins in KO1 cells expressing control short hairpin RNA (shCtrl) or cMyc short hairpin RNAs (shMyc #1, #2) upon exposure with or without IFNγ for 16 h.
(G and H) Representative immunoblots (G) and quantitative results (H) of indicated proteins in KO1, KO3, and KO7 cells treated with indicated treatments for 16 h. Stattic: STAT3 inhibitor.
(I and J) Representative immunoblots (I) and quantitative results (J) of indicated proteins in WT primary melanoma cells treated with indicated treatments for 16 h.
(K) Representative immunoblots of indicated proteins in indicated cell lines with quantitative analysis for STAT1/STAT3 ratios (right panel).
(L) Representative immunoblot (upper panel) and quantitative results (bottom panels) for indicated proteins in the primary HCC cells harboring β-catenin overexpression and Pten deletion derived from immunocompetent mice (WT cells) or Rag1−/− mice (KO cells).
(M) Representative immunoblots (left panel) and quantitative results (right panels) of indicated proteins in KO cells expressing control gRNA (Ctrl gRNA) or gRNAs targeting STAT1 (STAT1 gRNA) upon exposure with or without IFNγ for 16 h.
(N) Representative immunoblots (left panel) and quantitative results (right panels) of indicated proteins in WT cells expressing control gRNA (Ctrl gRNA) or gRNAs targeting STAT1 (STAT1 gRNA) upon exposure with or without IFNγ for 16 h.
(O) Illustration of the proposed model.
(P) Tumor growth curve for KO1, KO3, and KO7 expressing either control (Ctrl) or c-Myc overexpression vector (Myc_OE) upon subcutaneously engrafted into C57BL/6 wild-type mice (n = 5–8 per group).
Data are representative or cumulative results of at least two independent experiments with similar results. Each symbol represents one individual. Data are means ± SEM and analyzed by two-tailed, paired (A and B) or unpaired (C, F, H, and J–N) Student’s t test.
