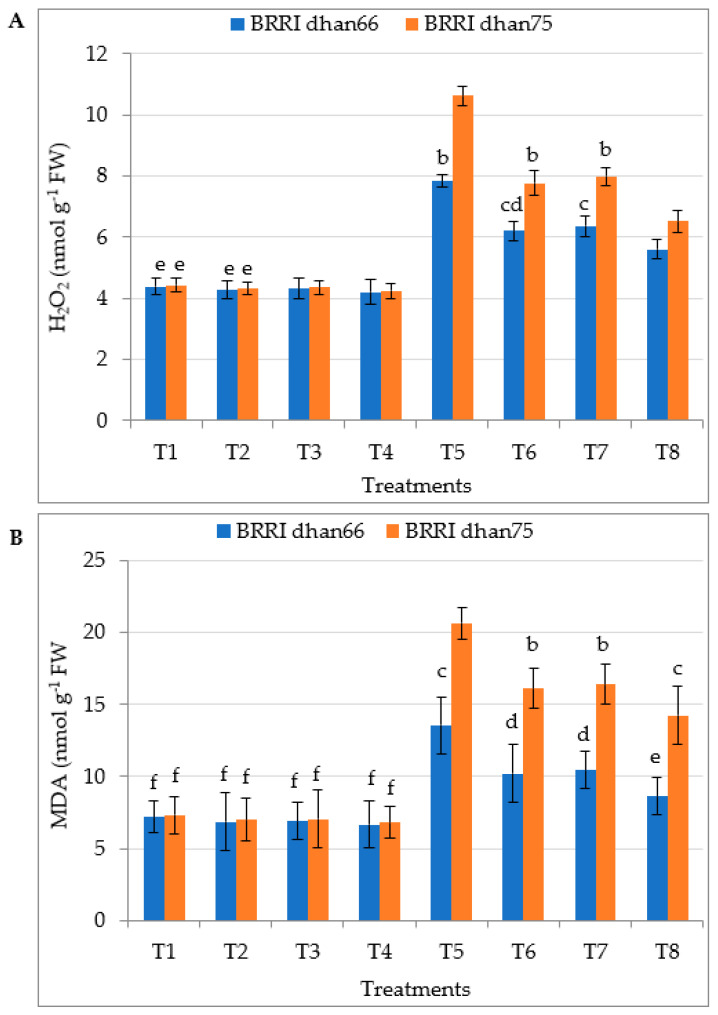
Figure 3.
Foliar application of salicylic acid and/or proline regulating (A) H2O2 and (B) MDA content of rice leaves under drought stress. The vertical bar indicates the means of five replicates (n = 5) and the error bar indicates the standard errors. Different letters indicate significant differences at p ≤ 0.05 (Tukey’s test). T1 = control, T2 = 1.5 mM SA, T3 = 2 mM proline, T4 = 0.75 mM SA + 1 mM proline, T5 = 45–50% FC (drought stress), T6 = T5 + 1.5 mM SA, T7 = T5 + 2 mM proline, and T8 = T5 + 0.75 mM SA + 1 mM proline.

