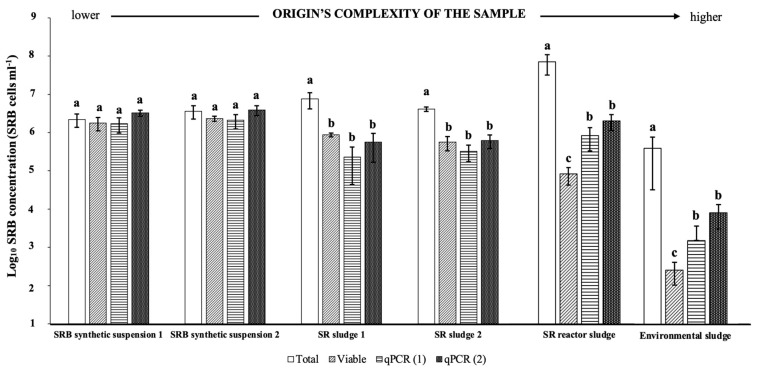
Figure 4.
Quantification by qPCR using primers DSR1F and RH3-dsr-R and a mixture of synthetic SRB suspension (1) and serial dilutions of SR sludge (2) for standard curve plotting, Neubauer counting (Total) and plate culture (Viable) in six samples: two synthetic SRB suspensions, two SR sludge samples, a sludge from an SR bioreactor, and an environmental sludge. The bar plot represents the means for each level of a one-way analysis of variance (ANOVA). Error bars indicate the standard error of the mean. In each group (sample), bars sharing the same letter are not significantly different, according to Tukey’s test.

