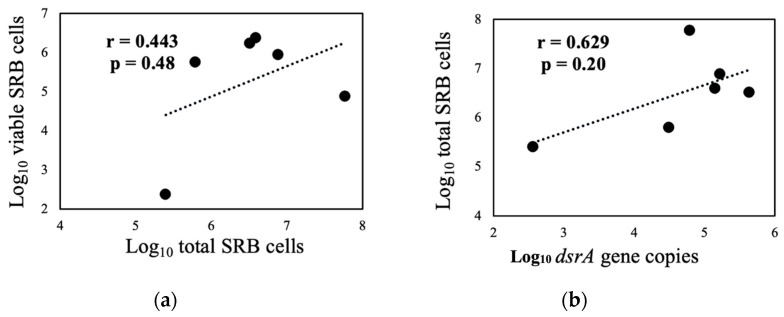
Figure A1.
Scattered plots depicting the relationships between (a) total SRB cells versus viable SRB cells, and (b) dsrA gene copies versus SRB total cells. The Pearson’s correlation coefficient is r (r > 0.7 indicates a strong relationship) and if the p-value is lower than 0.05, the correlation is considered statistically significant.

