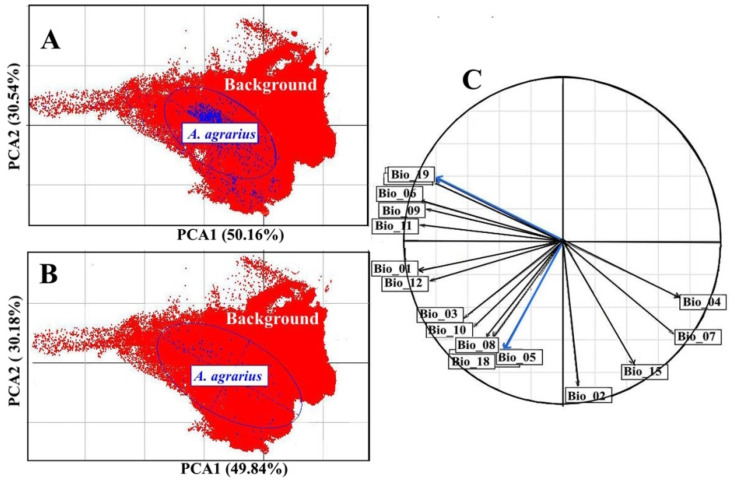
Figure 2.
Distribution of A. agrarius records (A,B) in the ecological space defined by the first two PCA axes, and (C) correlation circle showing the correlations between bioclimatic variables (see Figure S1). In the panels (A,B), the red color represents the background points, the blue dots represent the full (A) and the reduced records (B), respectively, and the blue lines represent the scatter ellipsoids of the full and reduced records. The blue arrows in the panel (C) are selected variables using PCA.

