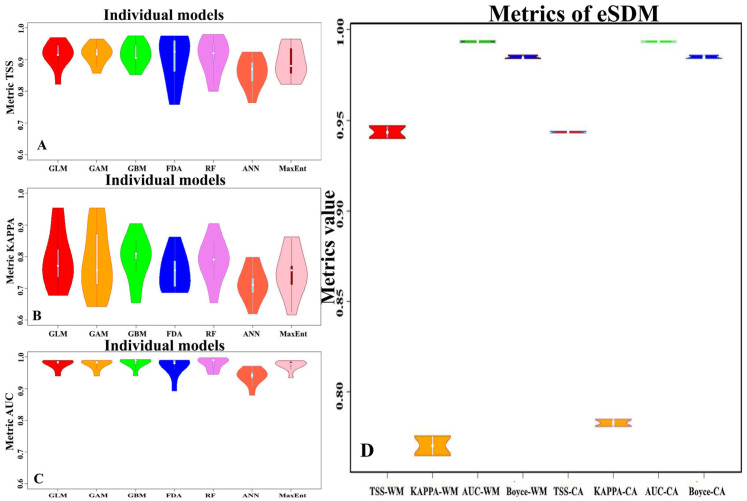
Figure 5.
Violin plots of predictive power of iSDMs and eSDM constructed by two strategies of iSDM aggregation WM (TSS-WM, KAPPA-WM, AUC-WM, Boyce-WM) and CA (TSS-CA, KAPPA-CA, AUC-CA, Boyce-CA), in panels (A–C) presented TSS, KAPPA, AUC metrics values for iSDMs respectively, and in the panel (D) presented TSS, KAPPA AUC, Boyce metrics values of eSDMs for both strategies (WM, CA) of aggregation.

