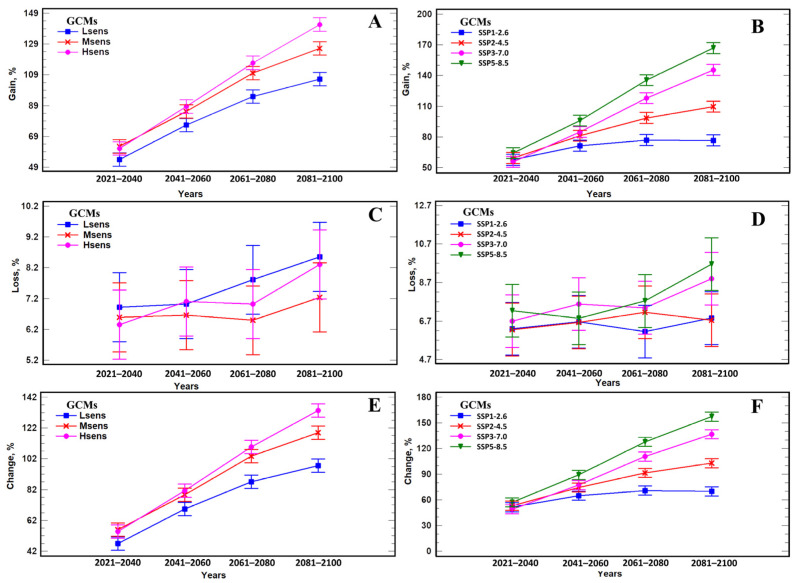
Figure 7.
Comparative analysis of gain, loss, and change metrics of A. agrarius areas under three groups of GCNs and four scenarios of global climate change using three-way analysis of variance (ANOVA) with fixed effects. Means are presented with Tukey’s 95% confidence intervals. In the panels (A,C,E) presented Gain, Loss and Change metrics values respectively, depending on GCM sensitivity (Hsens, Msens, Lsens), and in the panels (B,D,F) presented Gain, Loss and Change metrics values respectively, depending on climate change scenarios (SSPx-y).

