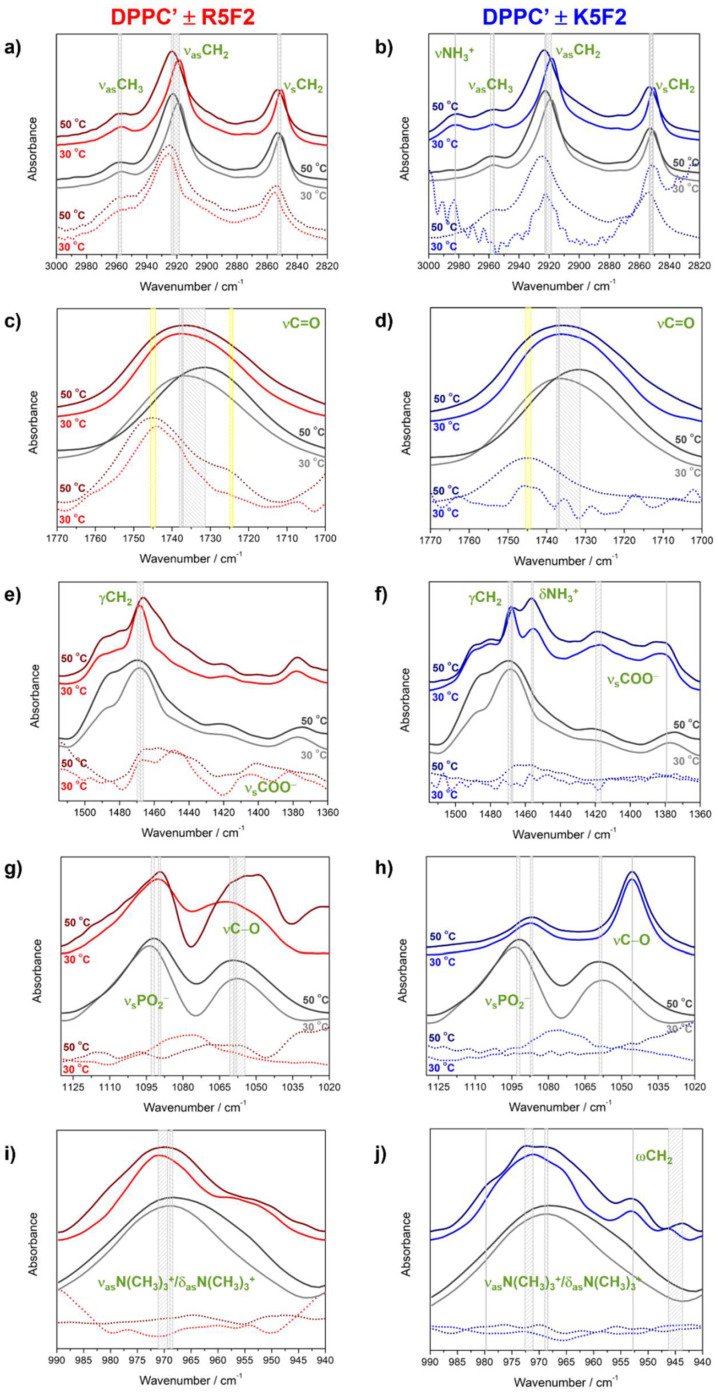
Figure 3.
Normalized (and smoothed) FTIR spectra of DPPC′ ± R5F2/K5F2 in the following spectral ranges: (a,b) 3000–2820 cm−1; (c,d) 1770–1700 cm−1; (e,f) 1515–1360 cm−1; (g,h) 1130–1020 cm−1; (i,j) 990–940 cm−1. DPPC′ spectra are presented with solid gray/dark gray (30 °C/50 °C) curves, DPPC′ + R5F2 with solid red/wine (30 °C/50 °C) curves, and DPPC′ + K5F2 with solid blue/navy (30 °C/50 °C) curves. The spectra of R5F2/K5F2 are labeled with the same color as corresponding spectra of DPPC′ + R5F2/K5F2 but with dotted curves. Along with the band assignment, their displacement in DPPC′ ± R5F2/K5F2 are designated with light gray-shaded rectangles or solid light gray lines, whereas in R5F2/K5F2 spectra they are marked with yellow rectangles.

