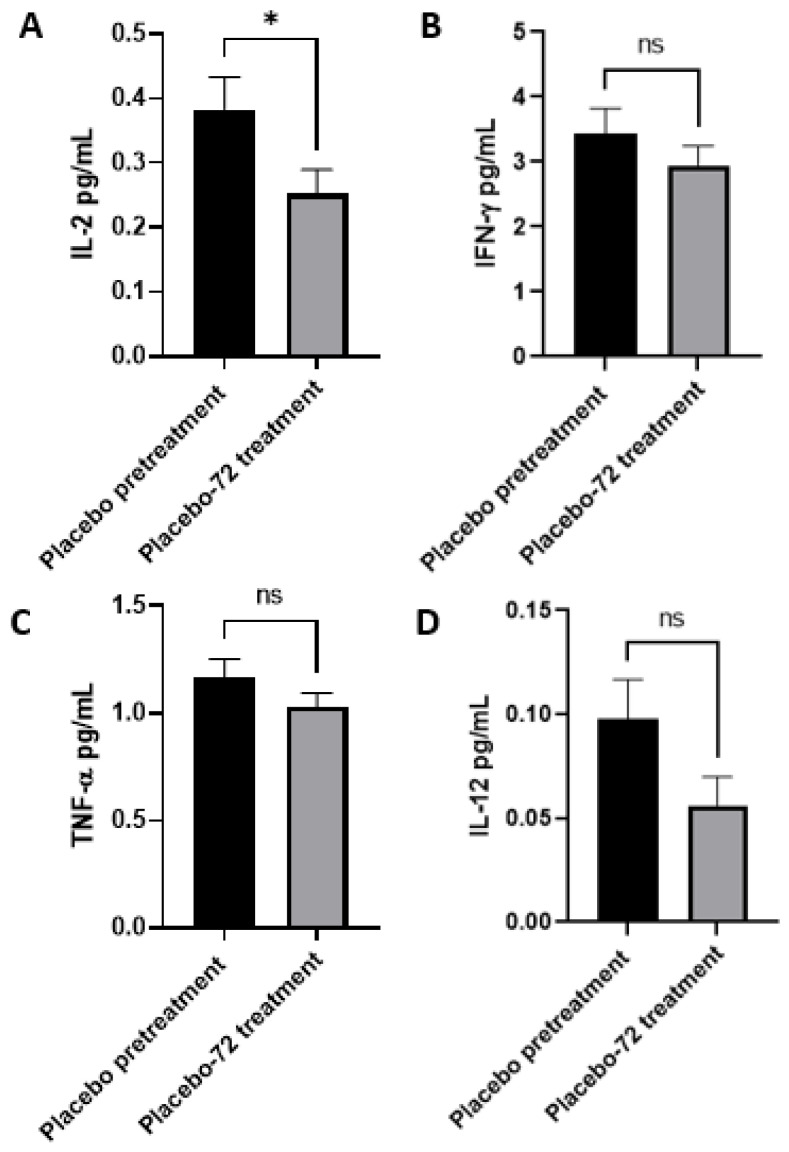
Figure A2.
Cytokine profile of healthy patients receiving placebo prior to and 72 h after initial topical application. (A) Levels of IL-2 in the plasma prior to (n = 14) and 72 h (n = 11) post-initial application. (B) Levels of IFN-γ in the placebo group plasma isolated prior to (n = 13) and 72 h (n = 14) post-initial application. (C) Levels of TNF-α in the plasma isolated prior to (n = 15) and 72 h (n = 13) post-initial application. (D) Levels of IL-12 in the plasma isolated from pretreatment (n = 15) and 72 h (n = 13) post-initial application. Out-of-range values were excluded. All comparisons were made via an unpaired t-test with Welch’s correction. Asterisks indicate statistical significance with a p-value < 0.05. NS refers to non-significant differences.

