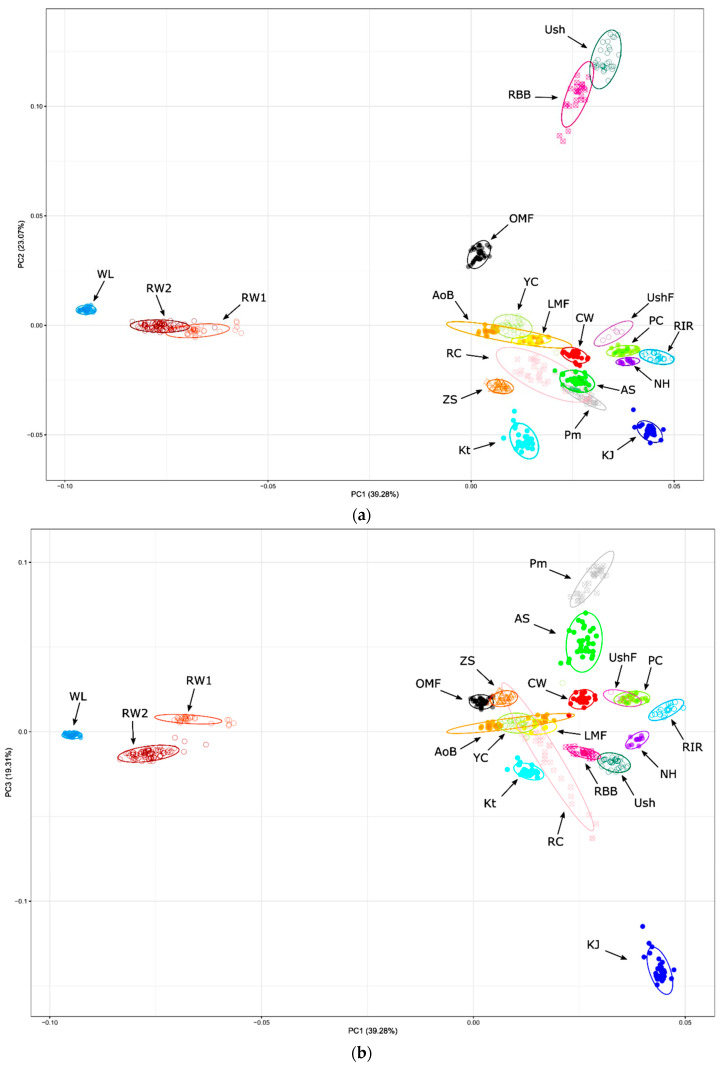
Figure 1.
PCA plots for the studied chicken breeds (populations) based on genome-wide SNP genotypes. Distribution of breeds and individuals is shown in the dimensions of three coordinates, i.e., the first (PC1; x-axis; (a,b)), second (PC2; y-axis; (a)) and third (PC3; y-axis; (b)) principal components (PCs), with the respective percentage of the total variance (within the parentheses), which can be explained by each of the two PCs. Breed codes are given in Table 1.

