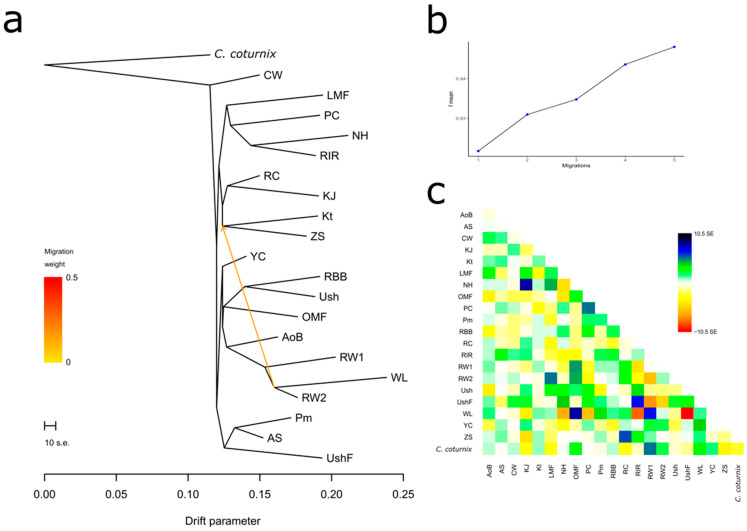
Figure 4.
Example of the assessed degree of divergence and the level of gene flow between the studied breeds using 25 iterations. (a) Rooted maximum likelihood tree with one migration event. Common quail (C. coturnix) was used as a root; cut length 10 s.e. corresponds to ten times the average standard error (s.e.) estimated from the sample covariance matrix. Estimated gene flow is shown by an arrow pointing from a donor population (ancestor of WL and RW2) to a recipient one (ancestor of Kt and ZS) and is colored red in proportion to the intensity of the gene flow. (b) Plot representing the proportion of variance (f-index) in the sample covariance matrix (¶W) accounted for by the model covariance matrix (W) as a function of the number of migration events. (c) Residual matrix derived from the TreeMix analysis for a single migration event, expressed as the number of standard error deviations for the observations in the respective breeds.

