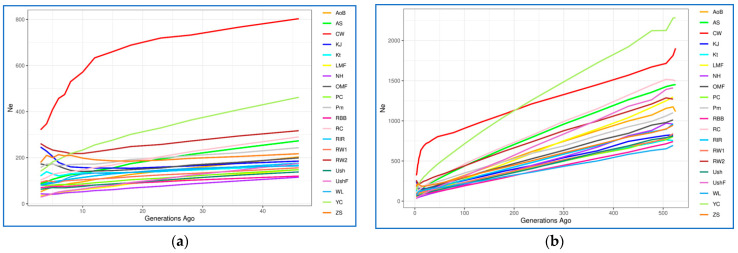
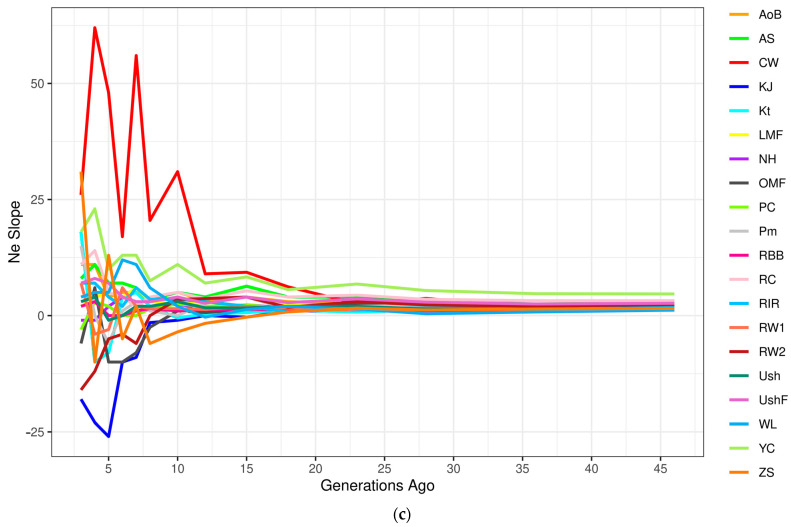
Figure 5.
Dynamics of effective population size (Ne) changes in the studied chicken breeds (populations). Absolute Ne change across generations from approximately 50 (a) and 500 (b) generations ago; (c) Ne slope (NeS), or relative Ne change across generations from approximately 50 generations ago: the continuous rate of change is shown as a horizontal straight line at point 0 on the y-axis, while deviations above and below zero represent, respectively, the relative increase and decrease in the changing NeS as compared to the previous generation. Breed codes are given in Table 1.


