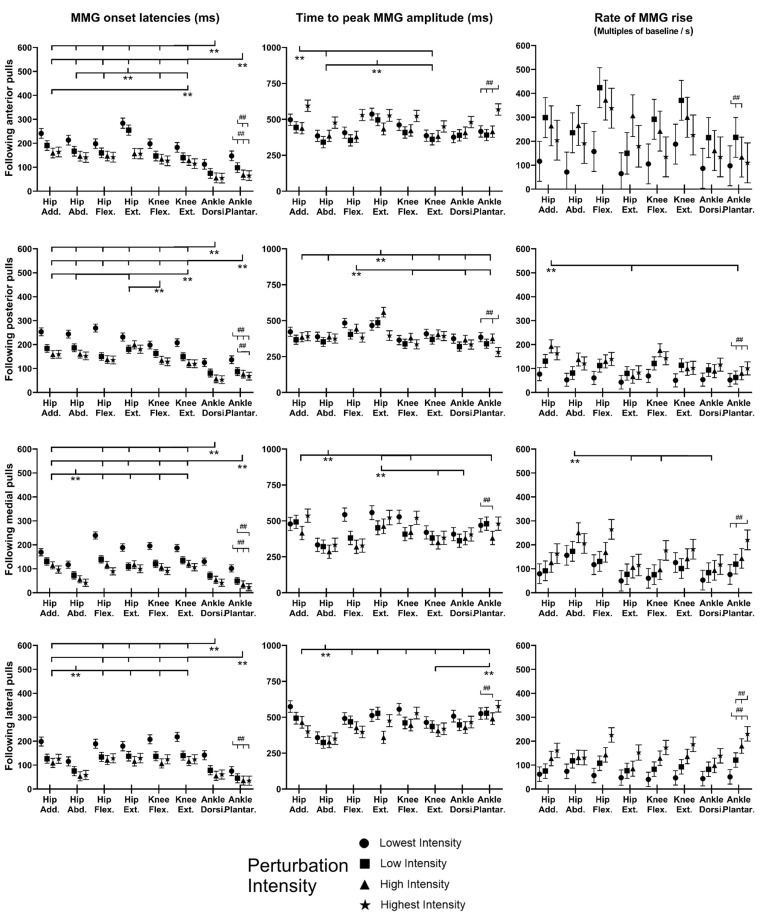
Figure 11.
The MMG-onset latencies, time to peak MMG amplitude, and rate of MMG rise for eight dominant leg muscles following unexpected horizontal perturbations (mean ± SE, n = 12). (Note:  or
or  represents post hoc pairwise comparison; SE, standard error; ## indicates significant main effects of intensity factor; ** indicates significant main effects of muscle factor.)

