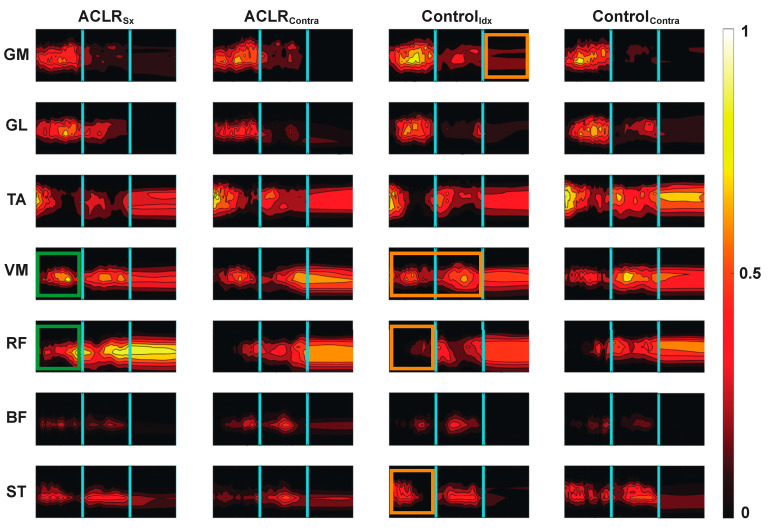
Figure 3.
Average wavelet muscle activity patterns. The horizontal axis represents each activity phase’s normalized time. The y axis in each figure represents the activation frequency (0 to 1000 Hz), and the contour intensity is the normalized activity intensity scaled from 0 to 1 mV/mV with the brighter colors representing a higher relative activation intensity. The cyan vertical lines delineate take-off, airborne, and landing hop phases. Significantly classified patterns between the ACLRSx and ControlIdx limbs [28] and ACLRSx and ACLRContra (e.g., Table 4b)) are highlighted by orange and green boxes, respectively. GM: Gastrocnemius medialis, GL: gastrocnemius lateralis, TA: tibialis anterior, VM: vastus medialis, RF: rectus femoris, BF: biceps femoris, and ST: semitendinosus.

