Figure 1.
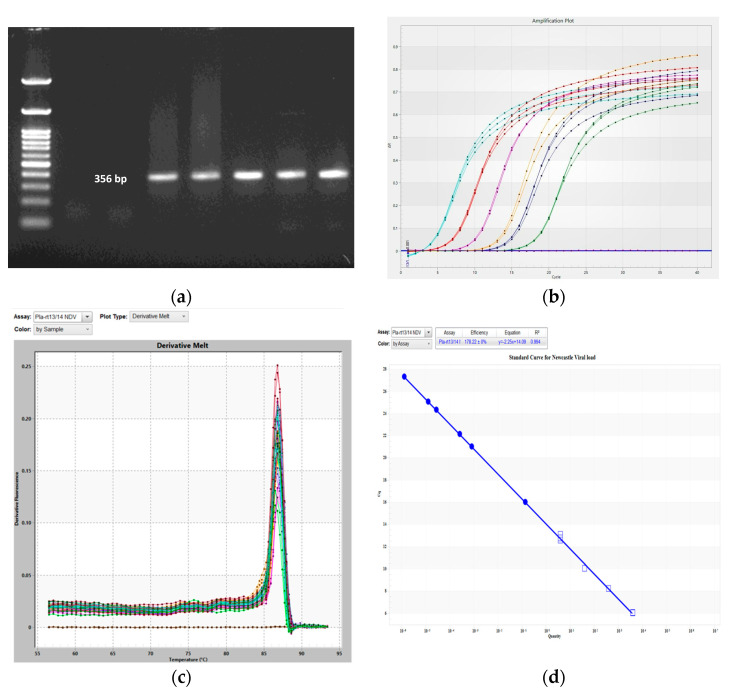
Newcastle disease virus detection and quantification. (a) PCR amplification of a 356 bp−long F−gene amplicon specific to the ND virus. (b–d) Real−time quantitative PCR assay creation for absolute quantification. (b) Amplification plot of serially diluted T−NP plasmid standard (each color indicates the different concentration T-NP plasmid at 10-1 to 10-6 dilution). (c) Melting curve. (d) Standard curve for ND viral load detection with linear regression equation Y = −2.25x + 14.09 and R2 score value 0.994.

