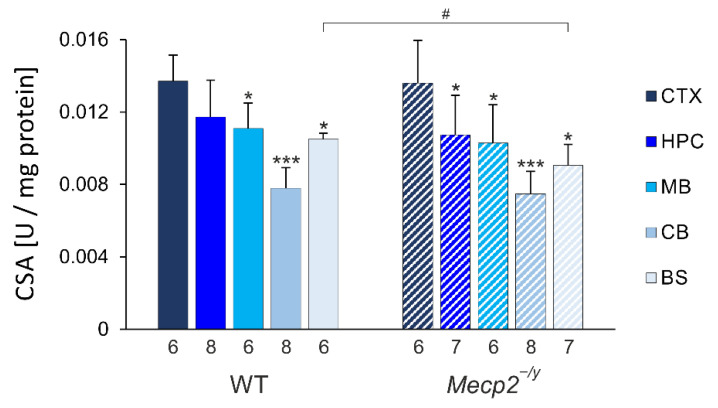
Figure 2.
Quantification of citrate-synthase activity (CSA) defines clear brain-regional differences in WT and Mecp2−/y mice. With neocortex (CTX) showing highest and cerebellum (CB) showing lowest activities, hippocampus (HPC), midbrain (MB), and brainstem (BS) present intermediate levels. RTT-related changes in CSA were uniquely found in brainstem. Data are plotted as means ± standard deviation. Genotype-matched brain regional differences as compared to neocortex are identified by asterisks (* p < 0.05, *** p < 0.001; one-way ANOVA mixed-effect analysis, post-hoc Dunnett´s multiple comparison test). RTT-related differences among genotypes are identified by crosshatches (# p < 0.05; unpaired 2-tailed Student´s t-test). The number of mice studied is reported below each of the bars plotted.

