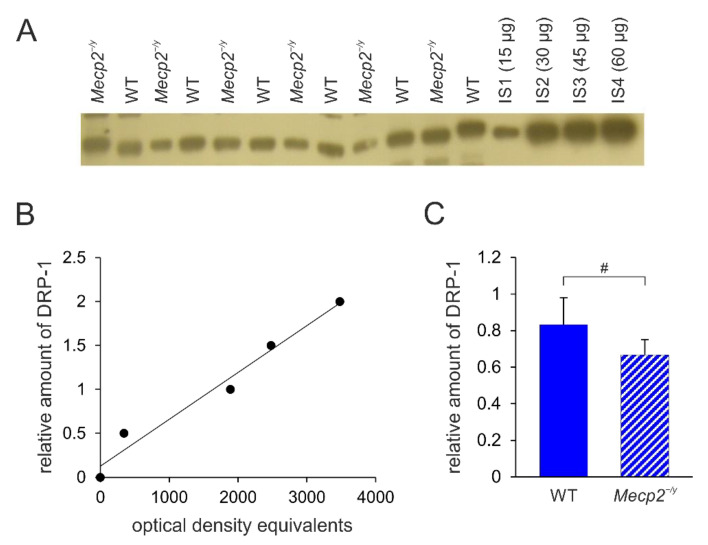
Figure 5.
DRP-1 expression in the hippocampus of Mecp2−/y and WT mice. (A) Sample film; each lane contains an individual sample. Lanes IS1-IS4 represent the internal standards containing 15, 30, 45, and 60 μg of protein, respectively. (B) The calibration plot was fitted by a linear least-squares regression. (C) Mean levels of DRP-1 (mean ± standard deviation) in the hippocampus of the two different groups of mice. RTT-related differences among genotypes are identified by crosshatches (# p < 0.05; unpaired 2-tailed Student´s t-test). See Supplementary Figure S1 for the original Western blot images.

