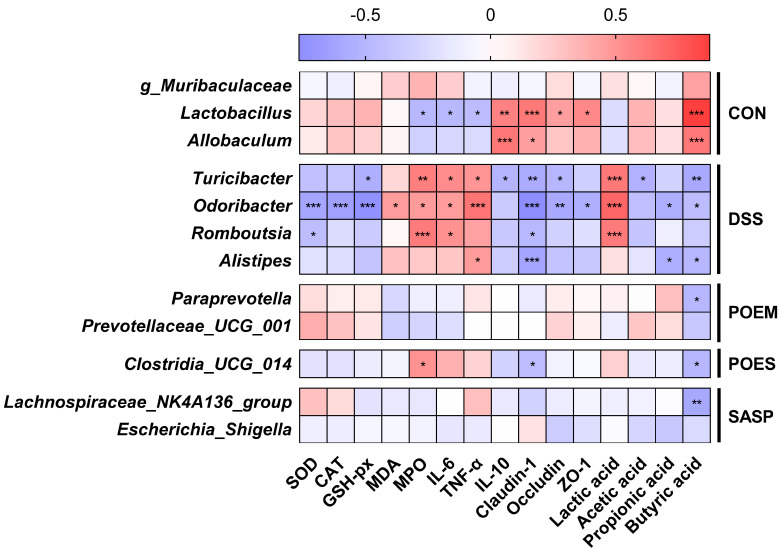
Figure 8.
Correlation analysis for ulcerative colitis (UC)-related indicators and the gut microbiota. A heatmap for correlation, as calculated through the Spearman correlation coefficients. Negative correlation (blue) and positive correlation (red) were expressed by color intensity. * p < 0.05, ** p < 0.01, *** p < 0.001, significant correlations.

