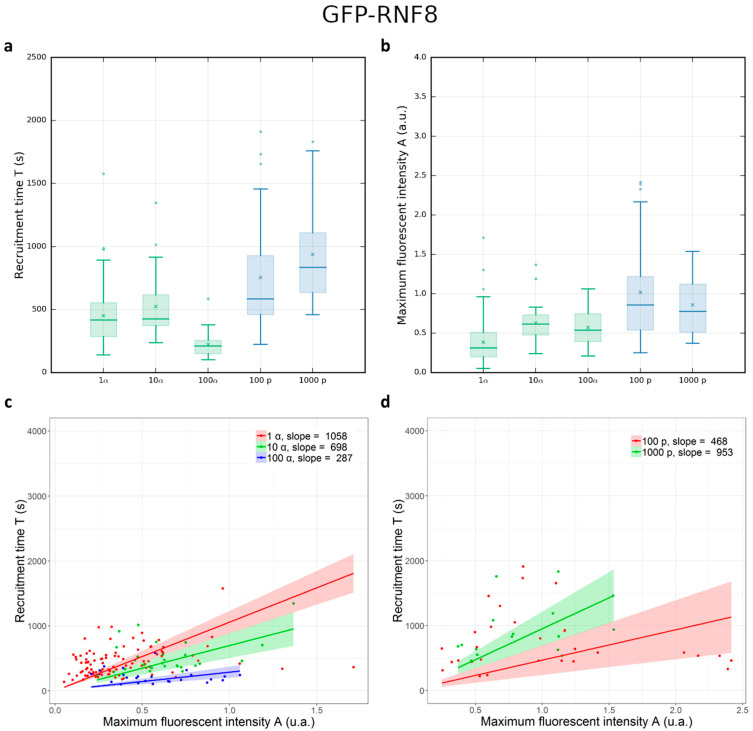
Figure 7.
Recruitment time (T) and amplitude of the fluorescent intensity (A) of GFP-RNF8 after proton and α-particle irradiations. (a) Box plots representing the recruitment times (T) of GFP-RNF8 cells after irradiation with increasing numbers of α-particles (green) and protons (blue). T changes as a function of the deposited energy when α-particles are increased from 10 to 100; it does not significantly change for the other irradiation condition. GFP-RNF8 protein accumulates faster when cells are irradiated with α-particles with respect to protons. (b) Box plots representing the amplitude of the GFP-RNF8 intensity in cell nuclei after irradiation with increasing numbers of α-particles (green) and protons (blue). A = 0 means no increase compared to the fluorescence intensity measured before irradiation. A does not change significantly with the number of delivered particles. Mean and median values are represented as a horizontal line and a cross in the box plots, respectively. Considering the two parameters T and A together for (c) α-particles and (d) protons, there is no dependency between T and A by increasing the number of delivered particles.

