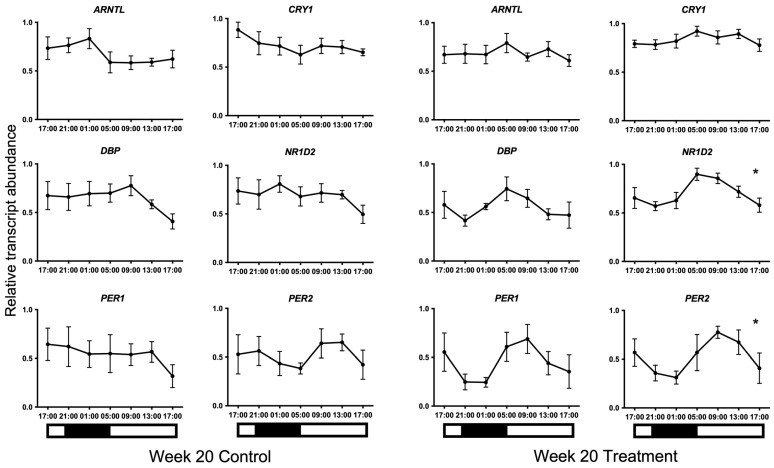
Figure 3.
24 h profiles of mRNA expression on Week 20. Plotted are normalised mRNA levels of the candidate genes relative to reference genes GAPDH and PPIA in equine hair follicles in the Control and Treatment lighting groups. Data are presented as means ± SEM. Cosinor analyses revealed significant 24 h variation for NR1D2 and PER2 and approached significance for CRY1 (p = 0.013, p = 0.013, and p = 0.051, respectively) on Week 20 in the treatment group only. * denotes significance at p < 0.05. Light and dark bars represent the light–dark cycle associated with the natural environmental photoperiod during sample collection.

