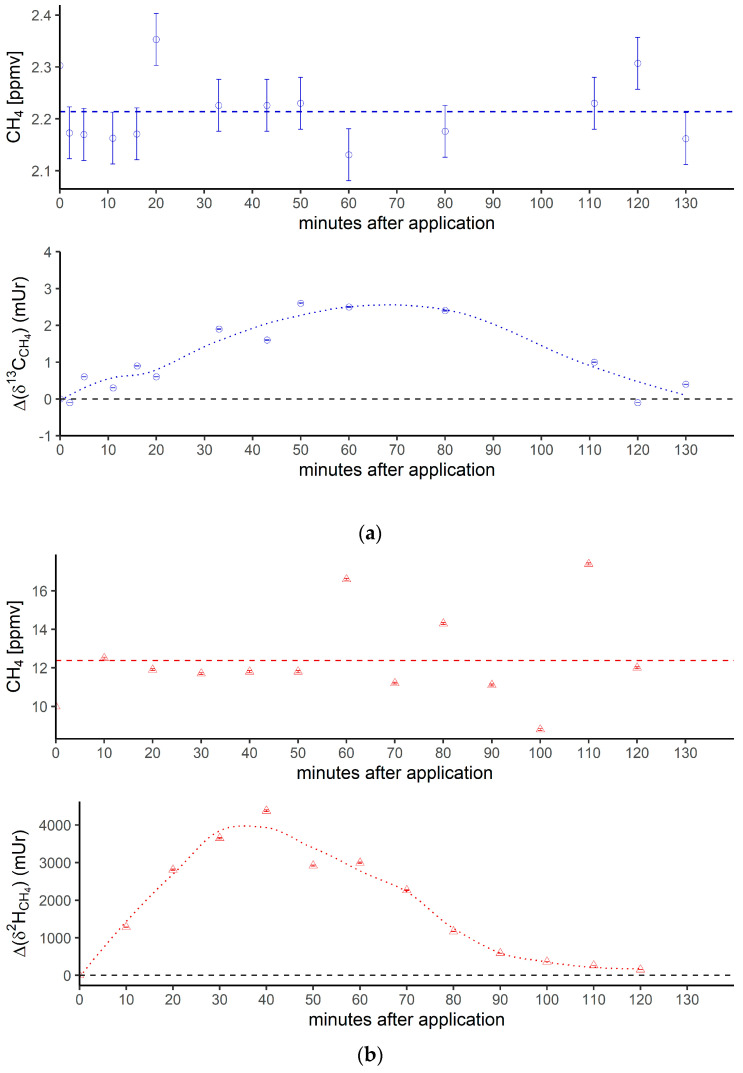
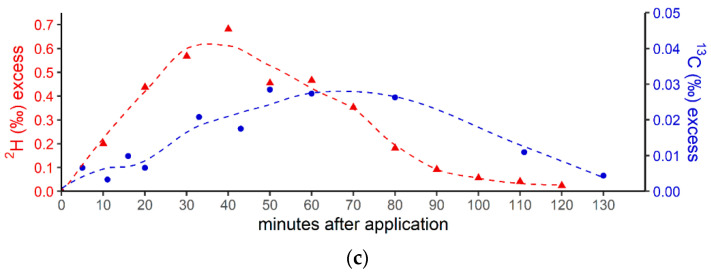
Figure 3.
(a) Breath CH4 production (top) and isotope difference as δ13C-CH4 values relative to control (bottom) after the oral intake of isotopically labeled 13C DMSO. The dashed line in the upper figure represents the CH4 mean value. Error bars represent a sum of the analytical uncertainties and statistical errors from triplicate measurements. (b) Breath CH4 production (top) and isotope difference of δ2H-CH4 values relative to the control (bottom) after the oral intake of isotopically labeled 2H DMSO. The dashed line in the upper figure represents the CH4 mean value. Error bars represent a sum of analytical uncertainties and statistical errors from triplicate measurements, and lie within the symbols. (c) 2H (red) and 13C (blue) isotopic excess after the oral administration of labeled 13C and 2H DMSO, respectively.


