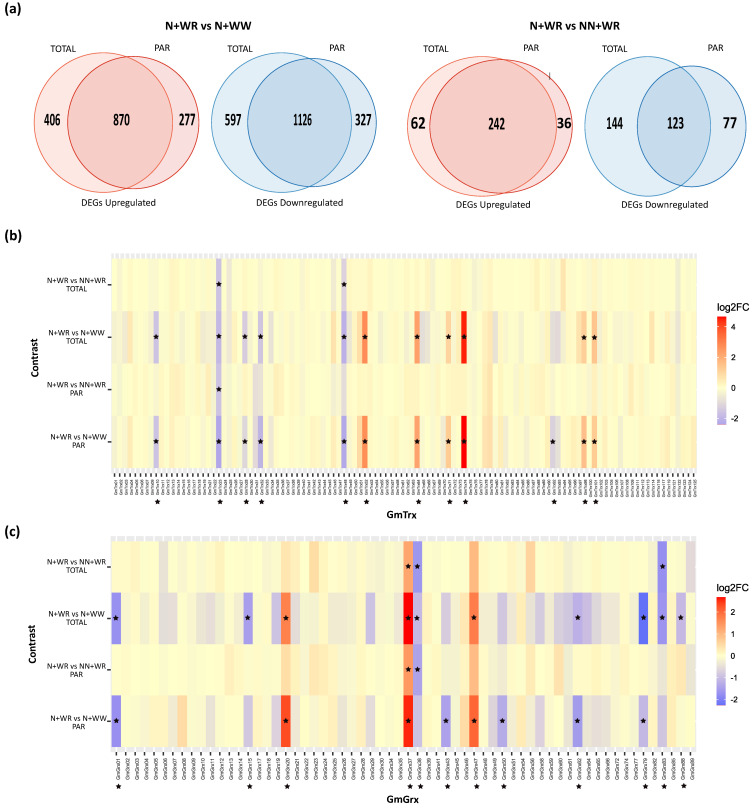
Figure 4.
Differentially expressed gene (DEG) analysis and GmTrx and GmGrx expression profiles in nodulated (N) and water-restricted (WR) plants with respect to well-watered (WW) and non-nodulated (NN) plants. (a) Venn diagrams showing up- and down-regulated genes in the N+WR vs. N+WW and N+WR vs. NN+WR contrasts in total RNA (TOTAL) and polysome-associated mRNA (PAR) fractions. (b) Expression profiles of GmTrx. (c) Expression profiles of GmGrx. Heatmaps were constructed from the RNA-seq experimental data. Asterisks indicate the differentially expressed GmTrx and GmGrx genes found in our study. Genes with |log2FC| > 1 and adjusted p-value (padj) < 0.05 were considered differentially expressed.

