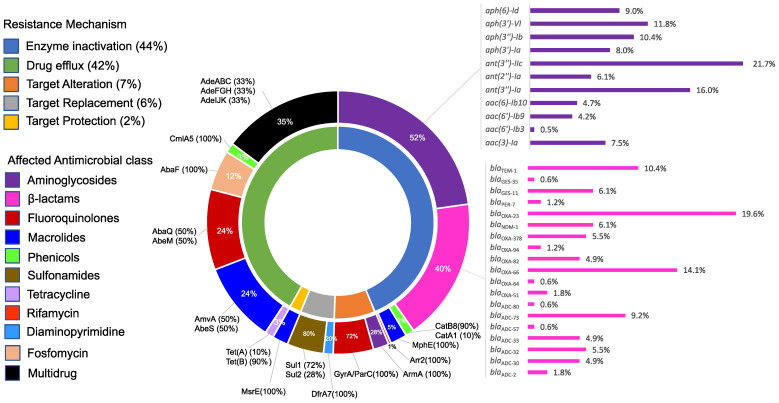
Figure 3.
Graphical representation of the in silico identified potential resistance determinants of the total collection of A. baumannii isolates. The figure shows the contribution of different resistance mechanisms to the resistome and the antimicrobial classes affected by each. For each antimicrobial class, the contribution of individual resistance determinants is also shown. The figure was created using Microsoft Office Excel 2016 and edited using Inkscape version 1.2 (https://inkscape.org, accessed on 10 September 2022).

