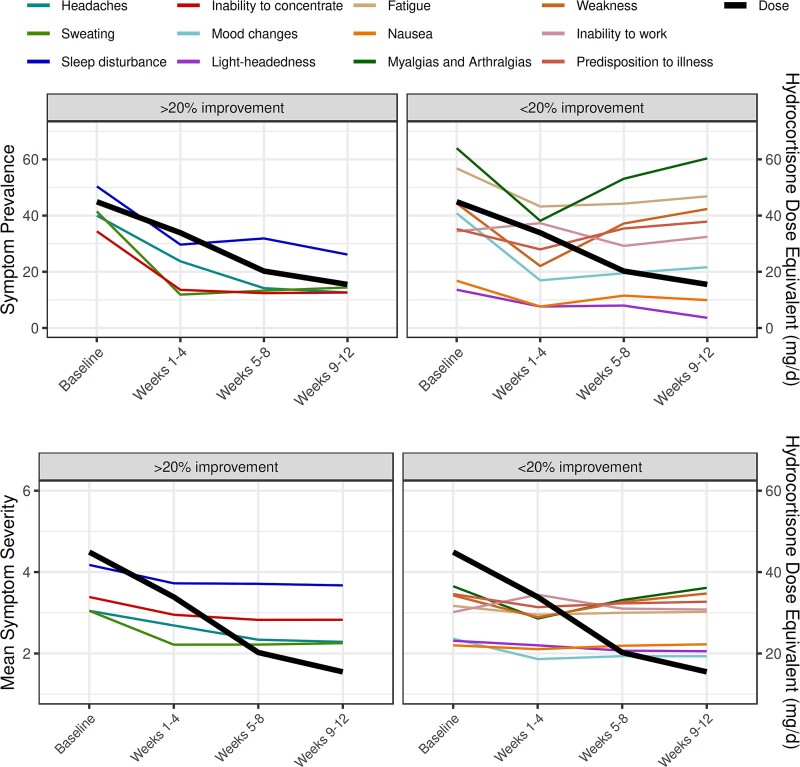
Figure 2.
Trajectory of glucocorticoid withdrawal symptoms following surgical remission of hypercortisolism. Symptoms are grouped into those that improved by >20% and those that improved by <20% within the first 12 weeks after surgery. The mean glucocorticoid dose (expressed as hydrocortisone dose equivalent/day) on the Y-axis on the right is superimposed. Mean symptom severity on the Y-axis on the left is based on frequency of symptom with 1 corresponding to the symptom being present “none of the time,” 2 corresponding to “a little of the time,” 3 corresponding to “some of the time,” 4 corresponding to “a good bit of the time,” 5 corresponding to “most of the time,” and 6 corresponding to “all of the time.”

