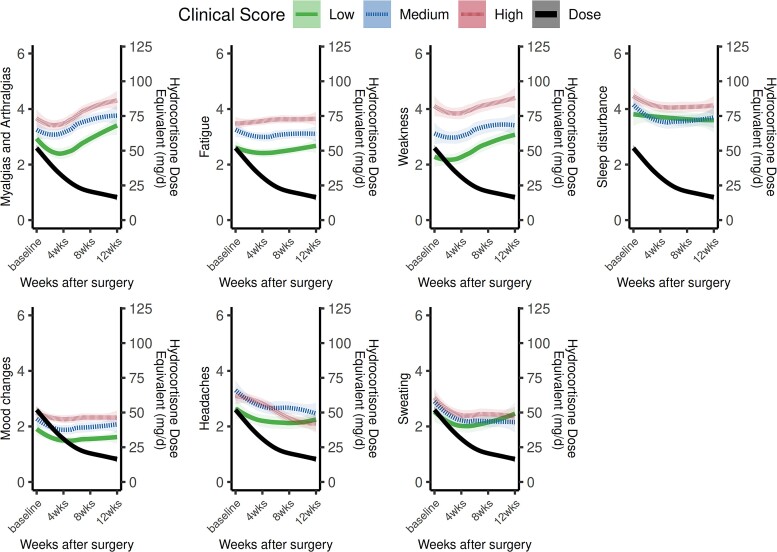
Figure 3.
Trajectory of individual symptoms following surgical remission of hypercortisolism, stratified by baseline clinical Cushing syndrome disease severity. The trajectory of the most prevalent symptoms in the postoperative period are graphed individually and stratified by baseline clinical Cushing syndrome disease severity (low, medium, or high). Mean symptom severity on the Y-axis on the left is based on frequency of symptom with 1 corresponding to the symptom being present “none of the time,” 2 corresponding to “a little of the time,” 3 corresponding to “some of the time,” 4 corresponding to “a good bit of the time,” 5 corresponding to “most of the time,” and 6 corresponding to “all of the time.” The mean glucocorticoid dose (expressed as hydrocortisone dose equivalent/day) on the Y-axis on the right is superimposed.

