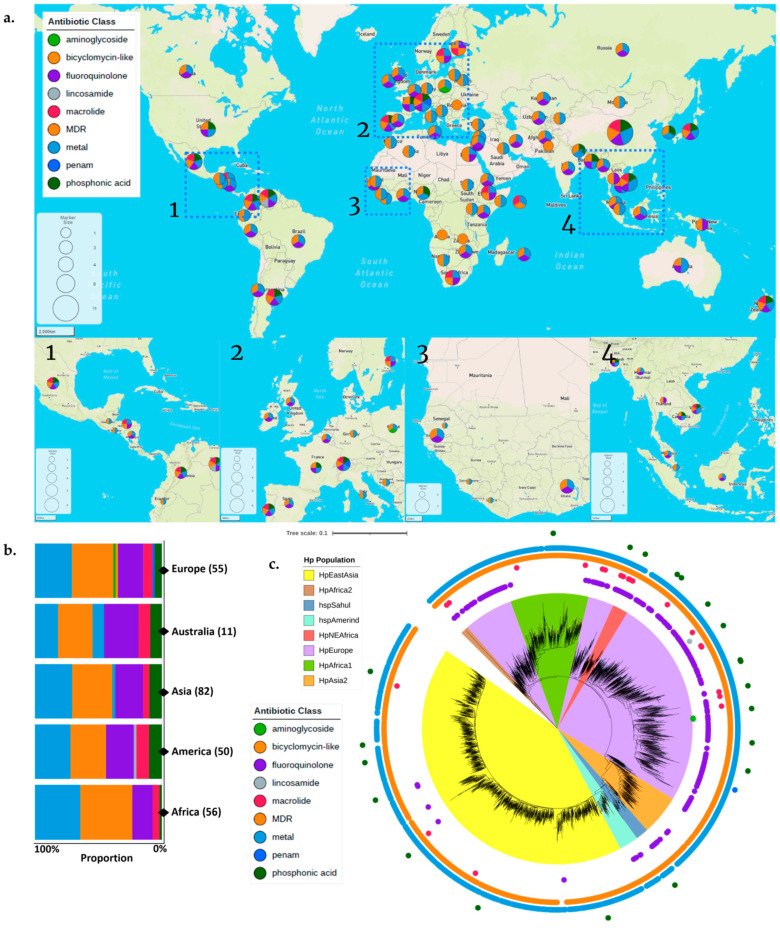
Figure 4.
The ARG-ACC distribution based on the geographic location and H. pylori population. The ARG-ACC were clustered based on their antibiotic classes. (a) The ARG-ACC distribution tended to be similar between countries. Some areas are magnified to show the distribution more clearly. The magnified regions were displayed in correspondence with their respective numerical designations. (b) The ARG-ACC proportion for each continent. The proportion tended to be the same for each continent. (c) The ARG-ACC distribution is based on the H. pylori population. Each dot outside the phylogenetic tree represents the ARG-ACC distribution, with each color representing its antibiotic class.

