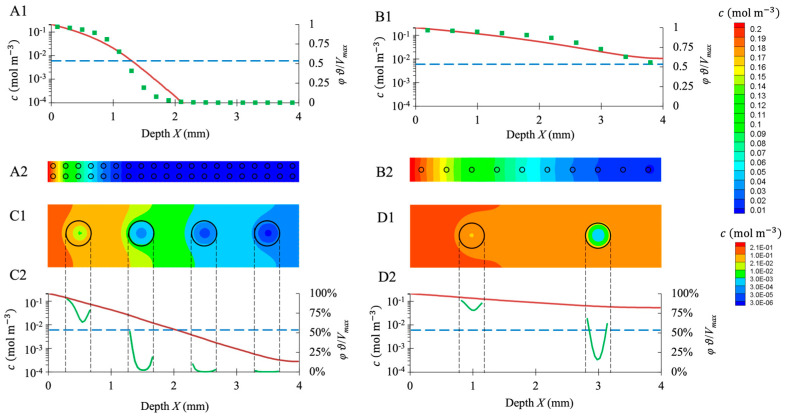
Figure 11.
LBM simulations of oxygen transport inside seeded hydrogel scaffolds. Four cases (A–D) are reported with two different seedings, i.e., 900,000 cells per scaffold (A1,A2,C1,C2) and 100,000 cells per scaffold (B1,B2,D1,D2), and two spheroid diameters, i.e., 80 μm (A1,A2,B1,B2) and 400 μm (C1,C2,D1,D2). (A1–D1): the oxygen concentration profile along the symmetry axis between two spheroid rows is plotted in red lines; the blue lines correspond to and , i.e., the hypoxia limit. The green squares (A1,B1) represent the oxygen consumption rate at the spheroid center (expressed as a percentage of ), the green lines (C1,D1) the oxygen consumption rate along the spheroid diameter. (A2–D2): oxygen concentration map in the scaffold median plane displayed in linear heat scale (A2,B2) or exponential heat scale (C2,D2). The black circles correspond to the spheroid outline.

