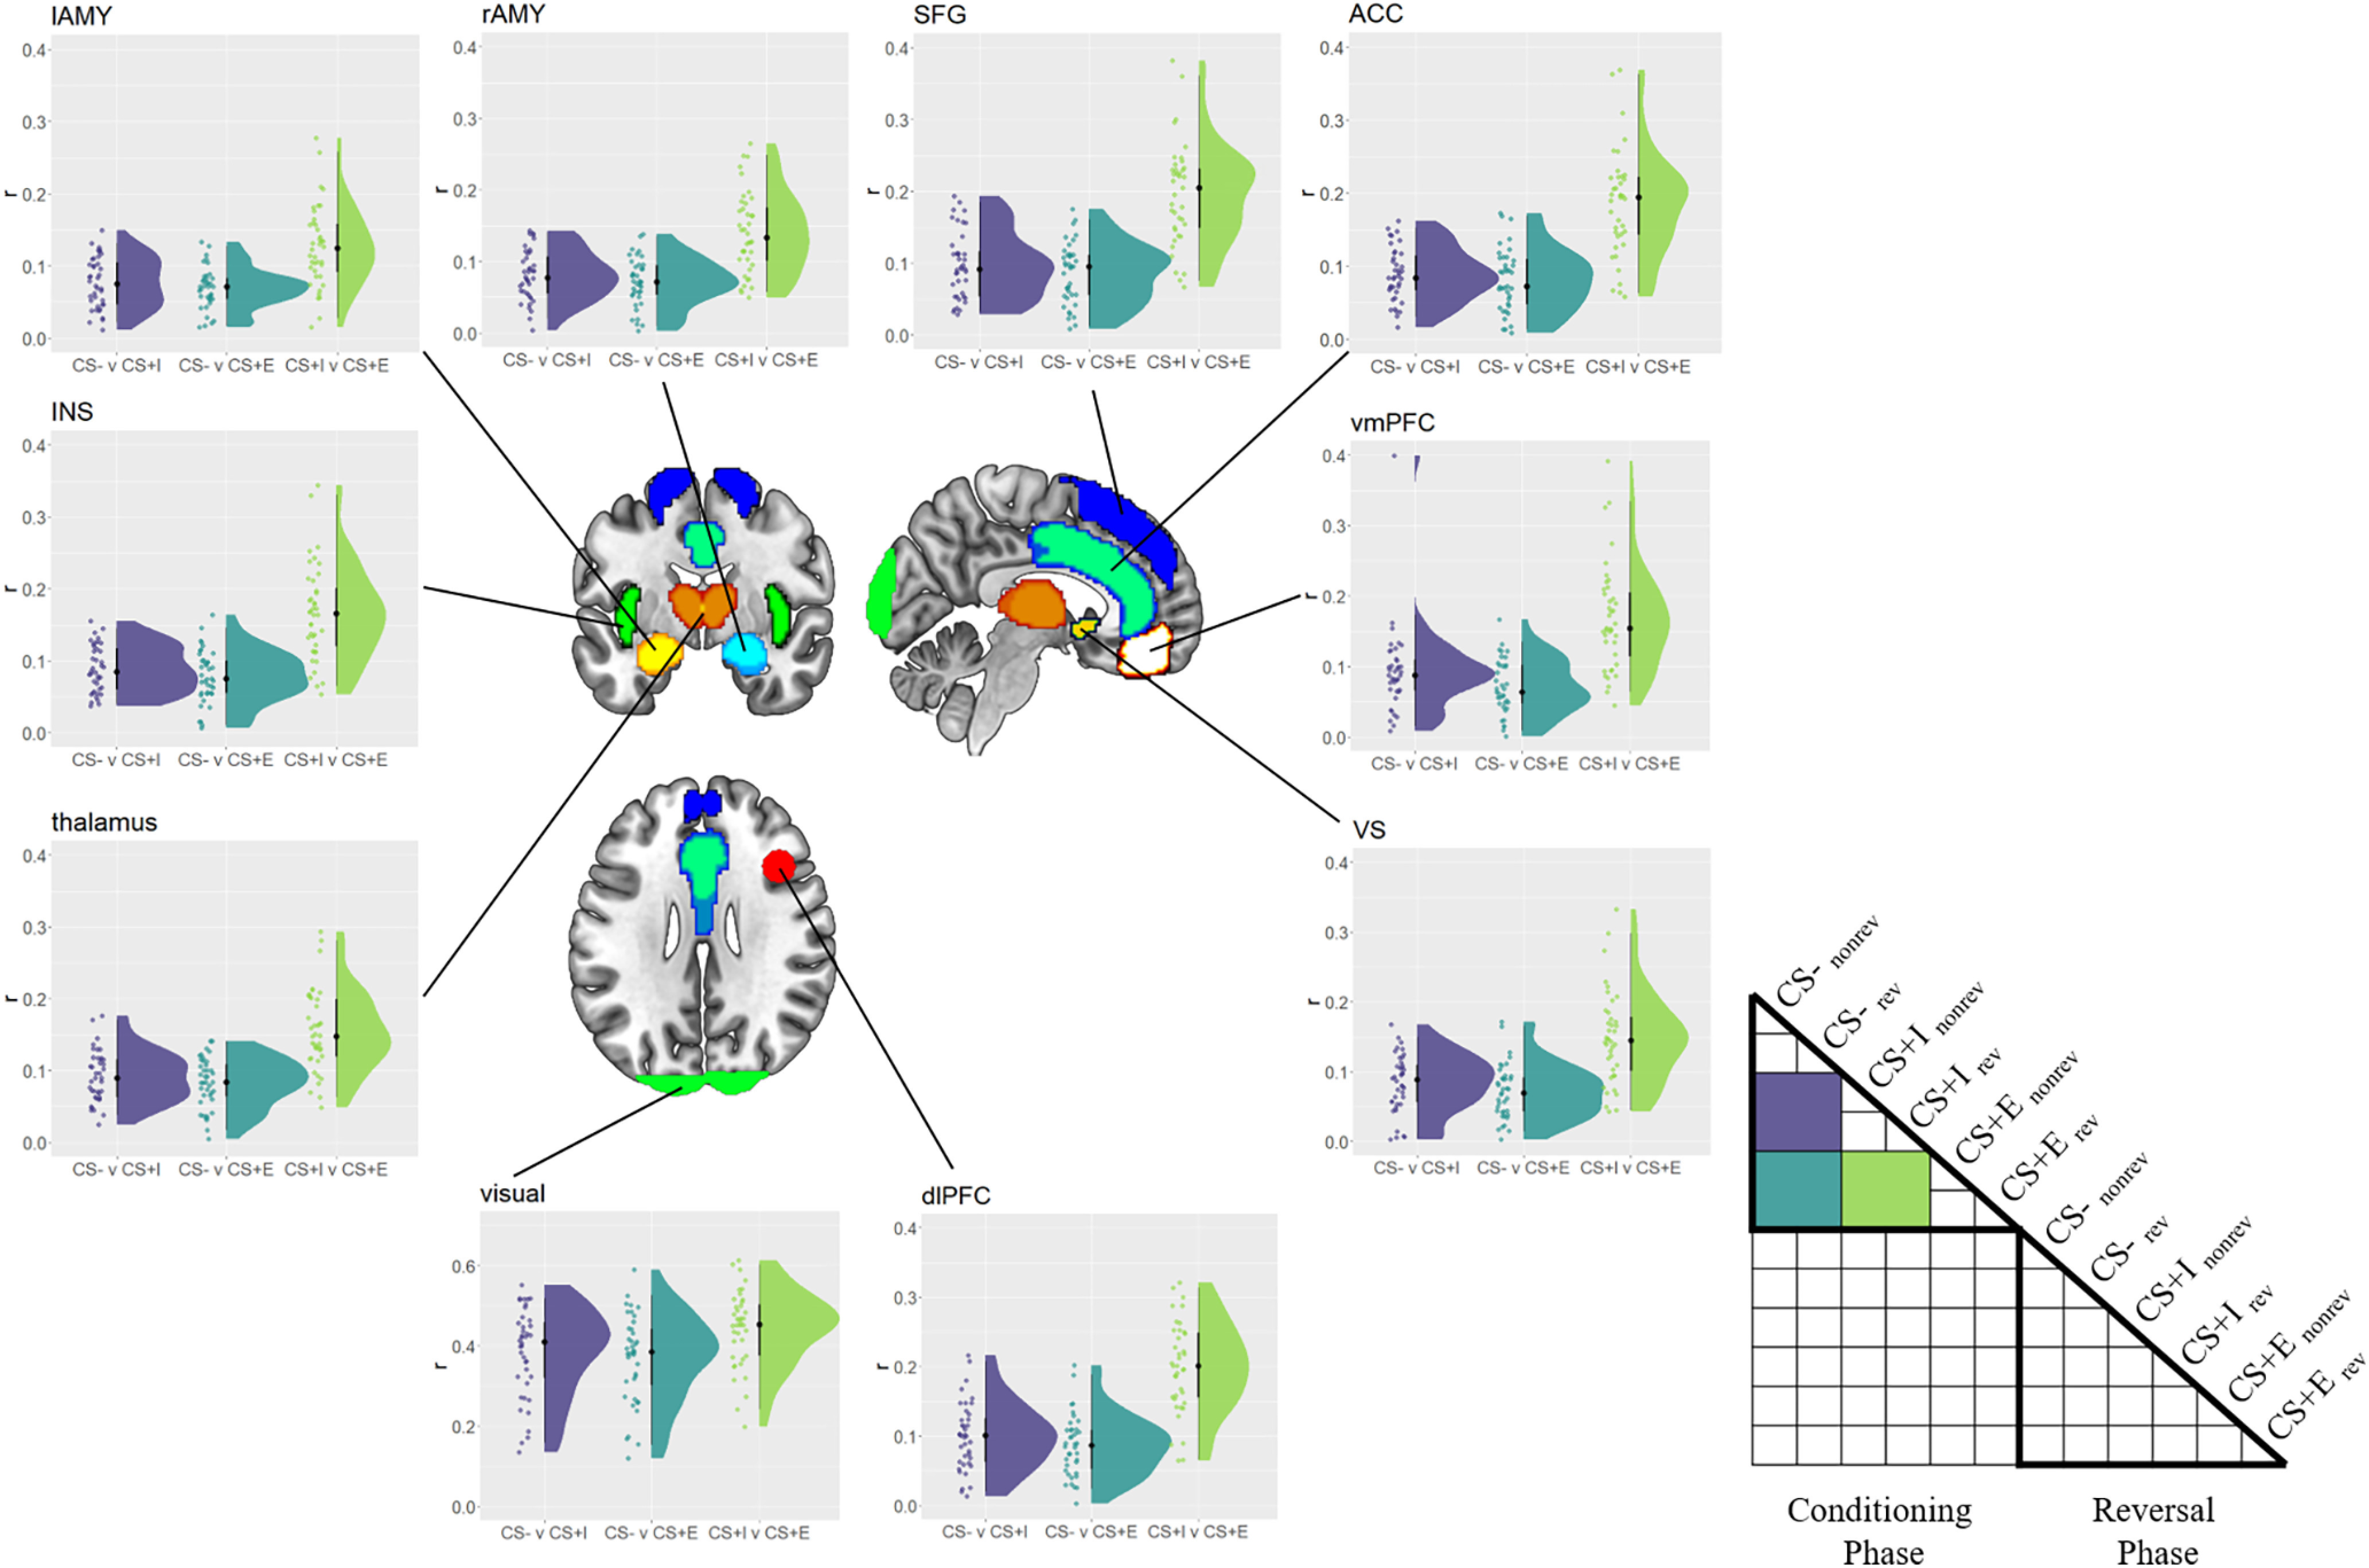
Figure 5.

Between-CS similarity in the conditioning phase. Similarity (r) among safe (CS–), merely instructed (CS+I), and instructed + experienced (CS+E) CSs in the conditioning phase, separately for each ROI. Raincloud plots depict the raw data as dots on the left side and the data distribution on the right side. The schematic RSM denotes which pairwise representational similarity measures were used in this analysis. rev = reversed, norev = not reversed.
