Figure 2.
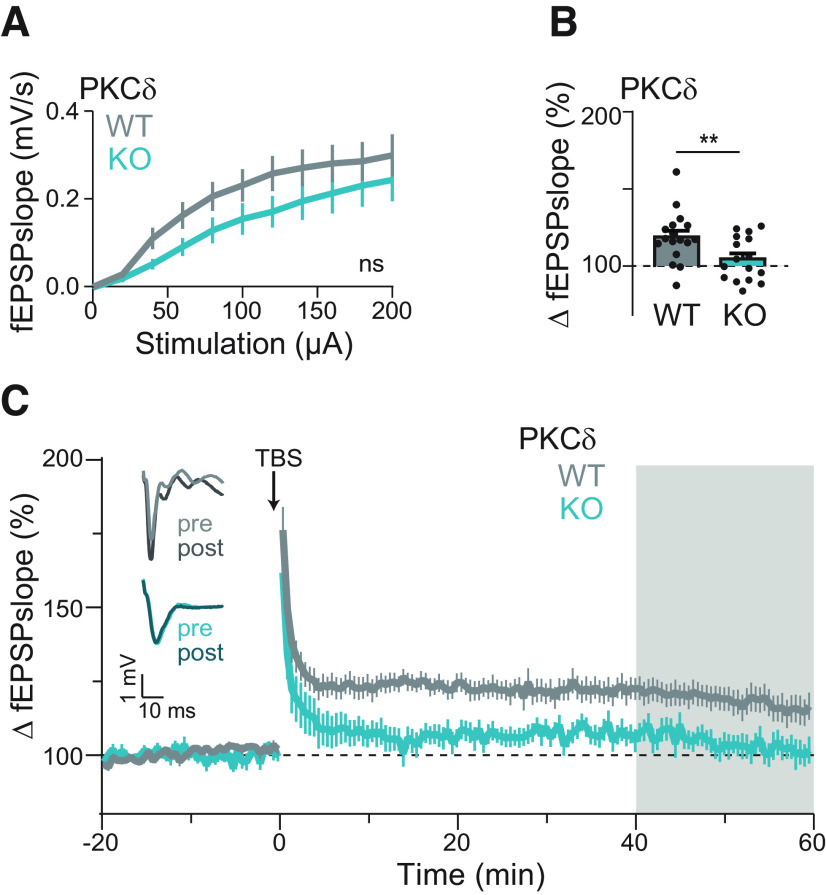
PKCδ is required for functional plasticity. A, Input–output curve of the fEPSP slopes between PKCδ WT and KO littermate mice. ns indicates results of repeated-measures two-way ANOVA by genotype (F(1,30) = 1.829, p = 0.19). B, C, Quantification (B) and time course (C) of change in fEPSPs' slope in PKCδ WT (n (neurons/animals) = 17/8) and PKCδ KO (n = 16/4) CA1 hippocampal neurons after field stimulation of Schaffer collaterals with a 3× or 5× TBS stimulation protocol. Gray shading represents the time of quantification in B. Insets, Left, Representative traces of fEPSPs before (pre) and after (post) stimulation from WT and KO slices. **p = 0.009 (unpaired t test).

