Figure 4.
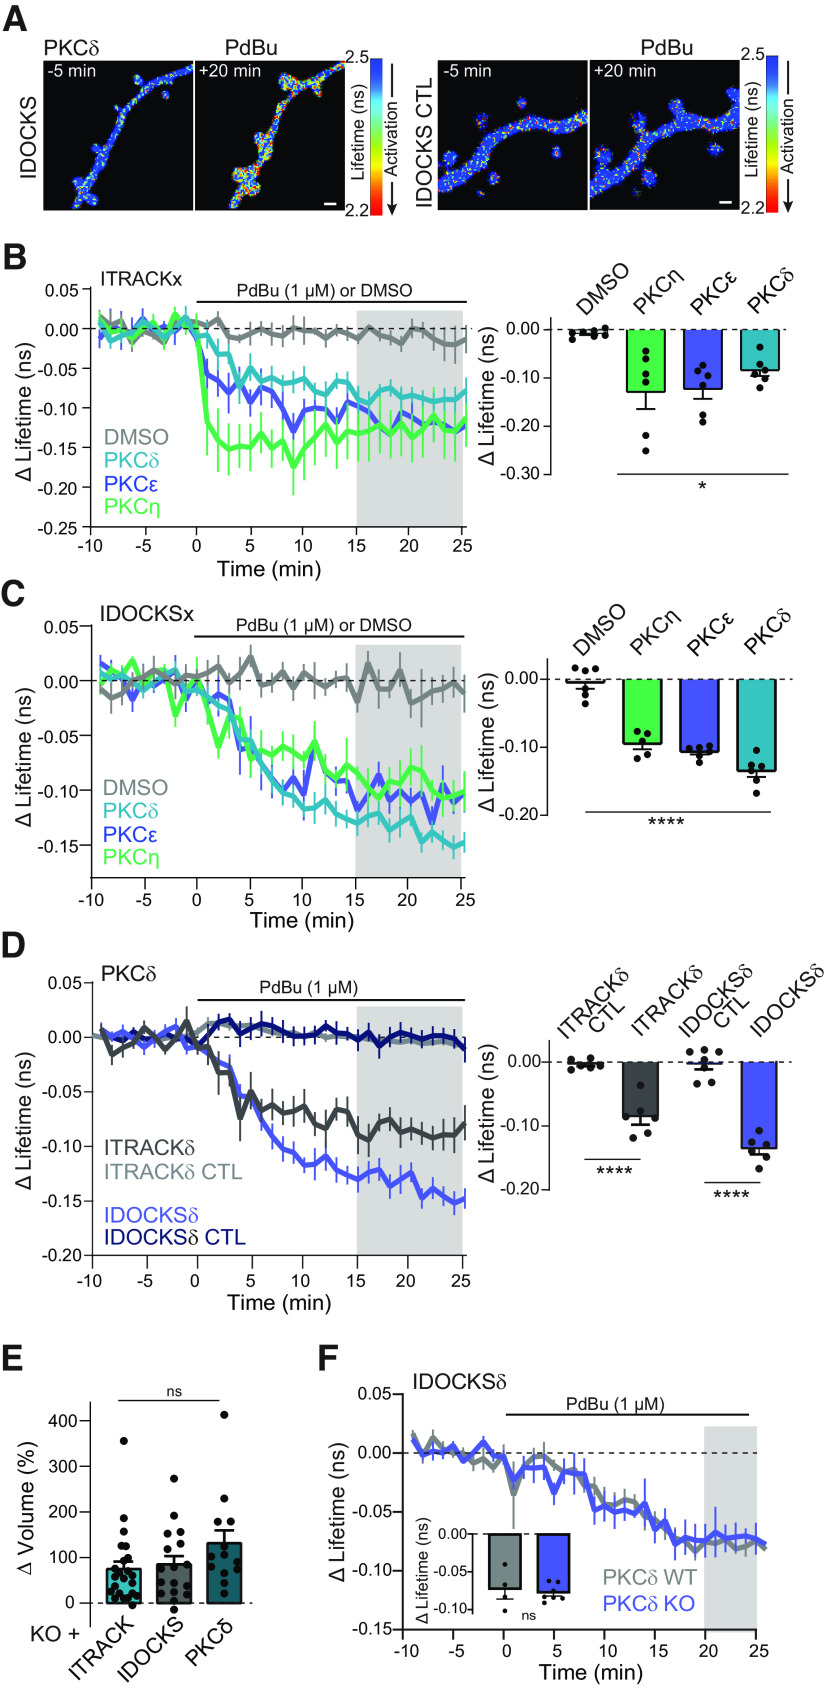
Characterization of FLIM-FRET sensors for novel PKC isozymes in neurons. A, Representative lifetime images of IDOCKS and IDOCKS CTL for PKCδ in nontransgenic hippocampal CA1 neurons in response to PKC activation by phorbol ester (1 μm PdBu). Warmer colors represent lifetime decrease and sensor activation. B, C, Time course and quantification of the change in the lifetime of ITRACKx (B) or IDOCKSx (C) for PKCδ, PKCε, or PKCη, measured in hippocampal CA1 neurons in response to bath application of PdBu or DMSO vehicle as indicated. Gray shading represents the time over which the average change was quantified (right). One-way ANOVA (F(3,19) = 54.98; p < 0.0001). *p < 0.05; ****p < 0.001; lowest level of significance between each PdBu and vehicle group (Sidak's multiple comparison post-test). n ≥ 5. D, Time course and quantification of mean change in the lifetime of ITRACK, IDOCKS, and CTL sensors for PKCδ in response to PdBu. Gray shading represents the time over which the average change was quantified (right). One-way ANOVA (F(3,21) = 57.85; p < 0.0001). Asterisks indicate significance between indicated comparisons tested by Sidak's multiple comparison post-test. p < 0.001. n ≥ 6 neurons. E, Change in volume of dendritic spines 5 min after stimulation by a glutamate uncaging sLTP protocol in hippocampal CA1 neurons expressing ITRACKδ, IDOCKSδ, or GFP-PKCδ (n (neurons, spines ≥ 4,13, one-way ANOVA; ns, p > 0.16) F, Time course and quantification of mean change in the lifetime of IDOCKSδ expressed in hippocampal CA1 neurons from nontransgenic WT or PKCδ KO animals in response to PdBu (n ≥ 4 neurons, two-way unpaired t test, ns, p = 0.75).

