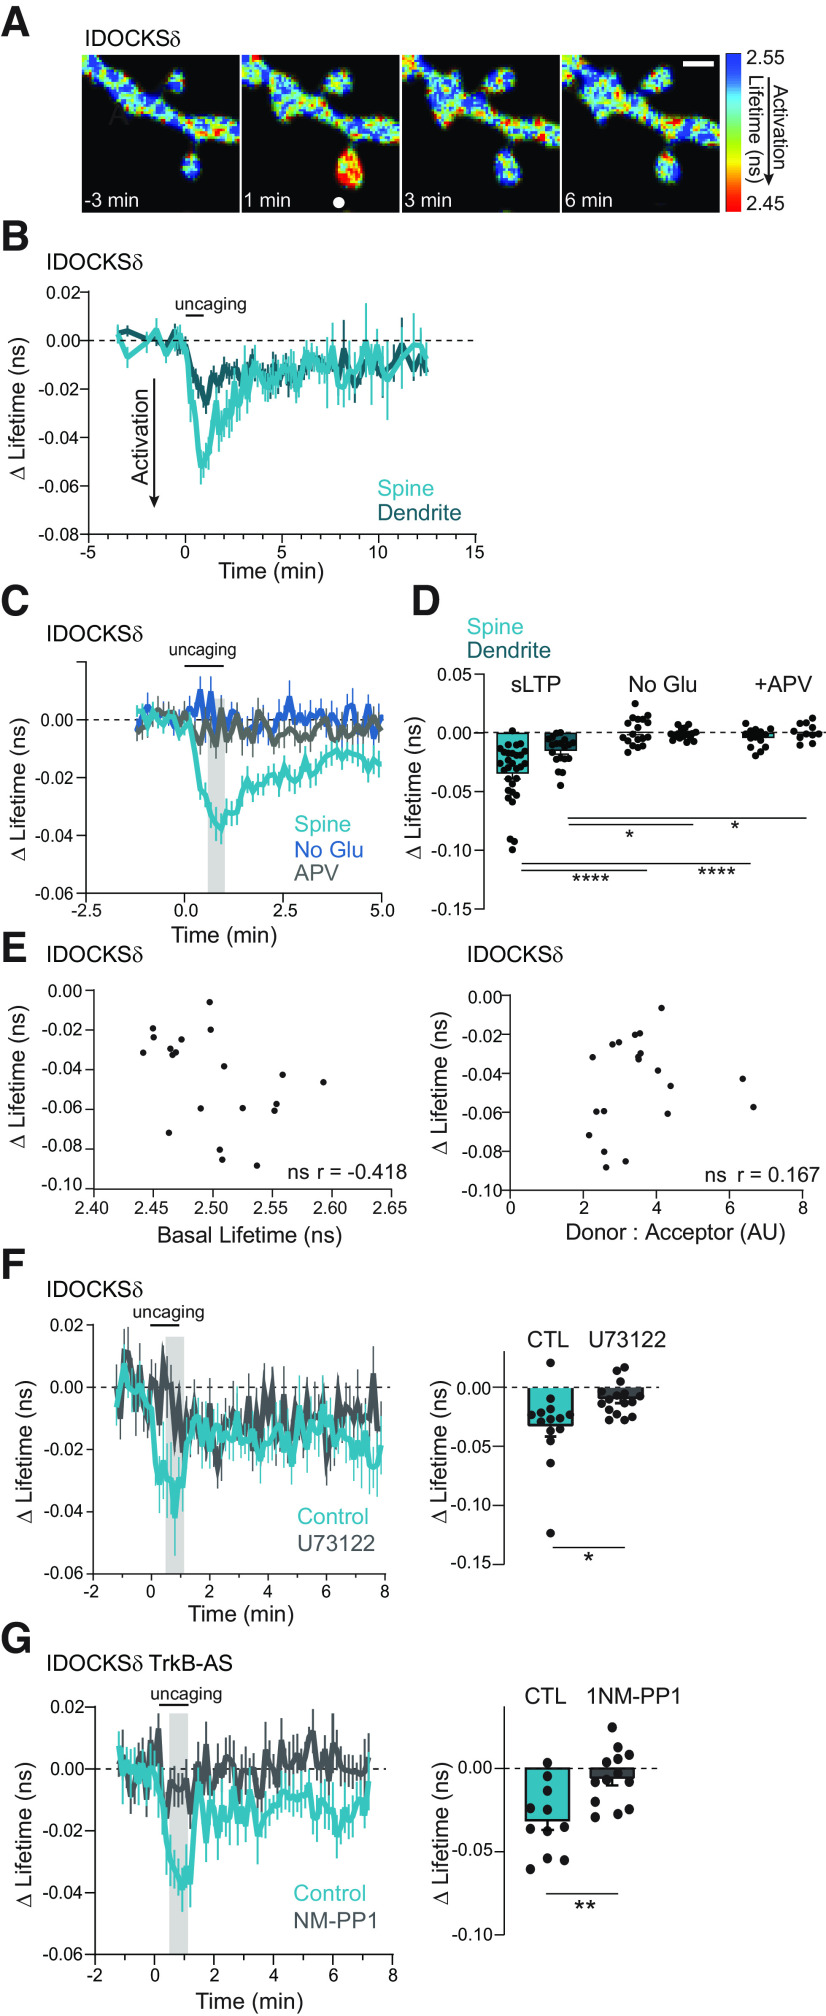
Figure 5.
PKCδ is transiently activated in stimulated spines during plasticity. A, Fluorescence lifetime images of IDOCKSδ in a single spine undergoing sLTP. White dot indicates uncaging location. Scale bar, 1 μm. Warmer colors represent shorter lifetimes and PKCδ activation. B, Mean time course of PKCδ activity in the stimulated spine and underlying dendrite measured by the change in the lifetime of IDOCKS during sLTP. n (spines/neurons) = 26/10. C, D, Time course (C) and quantification (D) of mean lifetime change at the time indicated by gray shading in C and in response to uncaging stimulation in the absence of caged glutamate (No Glu n = 17/9) or the presence of the NMDAR antagonist APV (50 μm, n = 13/6). Two-way ANOVA, by treatment (F(2,105) = 32.96; p < 0.0001). ****p < 0.0001; ***p = 0.0004; Sidak's multiple comparisons. E, Left: Relationship between basal lifetime of sensor and plasticity-induced change in lifetime. Correlation was nonsignificant; ns, p = 0.067. n = 20. Right: Relationship between ratio of donor: acceptor and plasticity-induced change in lifetime. Correlation was ns. p = 0.482. n = 20. F, The mean time course (left) and quantification (right) of PKCδ activity in stimulated spines in neurons in the absence (n = 14/7) or presence of a phospholipase C inhibitor, U73122 (10 μm n = 16/7), two-way, unpaired t-test *p = 0.014. G, The mean time course (left) and quantification (right) of PKCδ activity in stimulated spines in neurons containing an inert analog-sensitive mutation in TrkB-AS in the presence of vehicle (CTL, n = 11/5) or inhibitory ATP analog (1NM-PP1, 1 μm n = 13/5), two-way, unpaired t-test **p = 0.0029.

