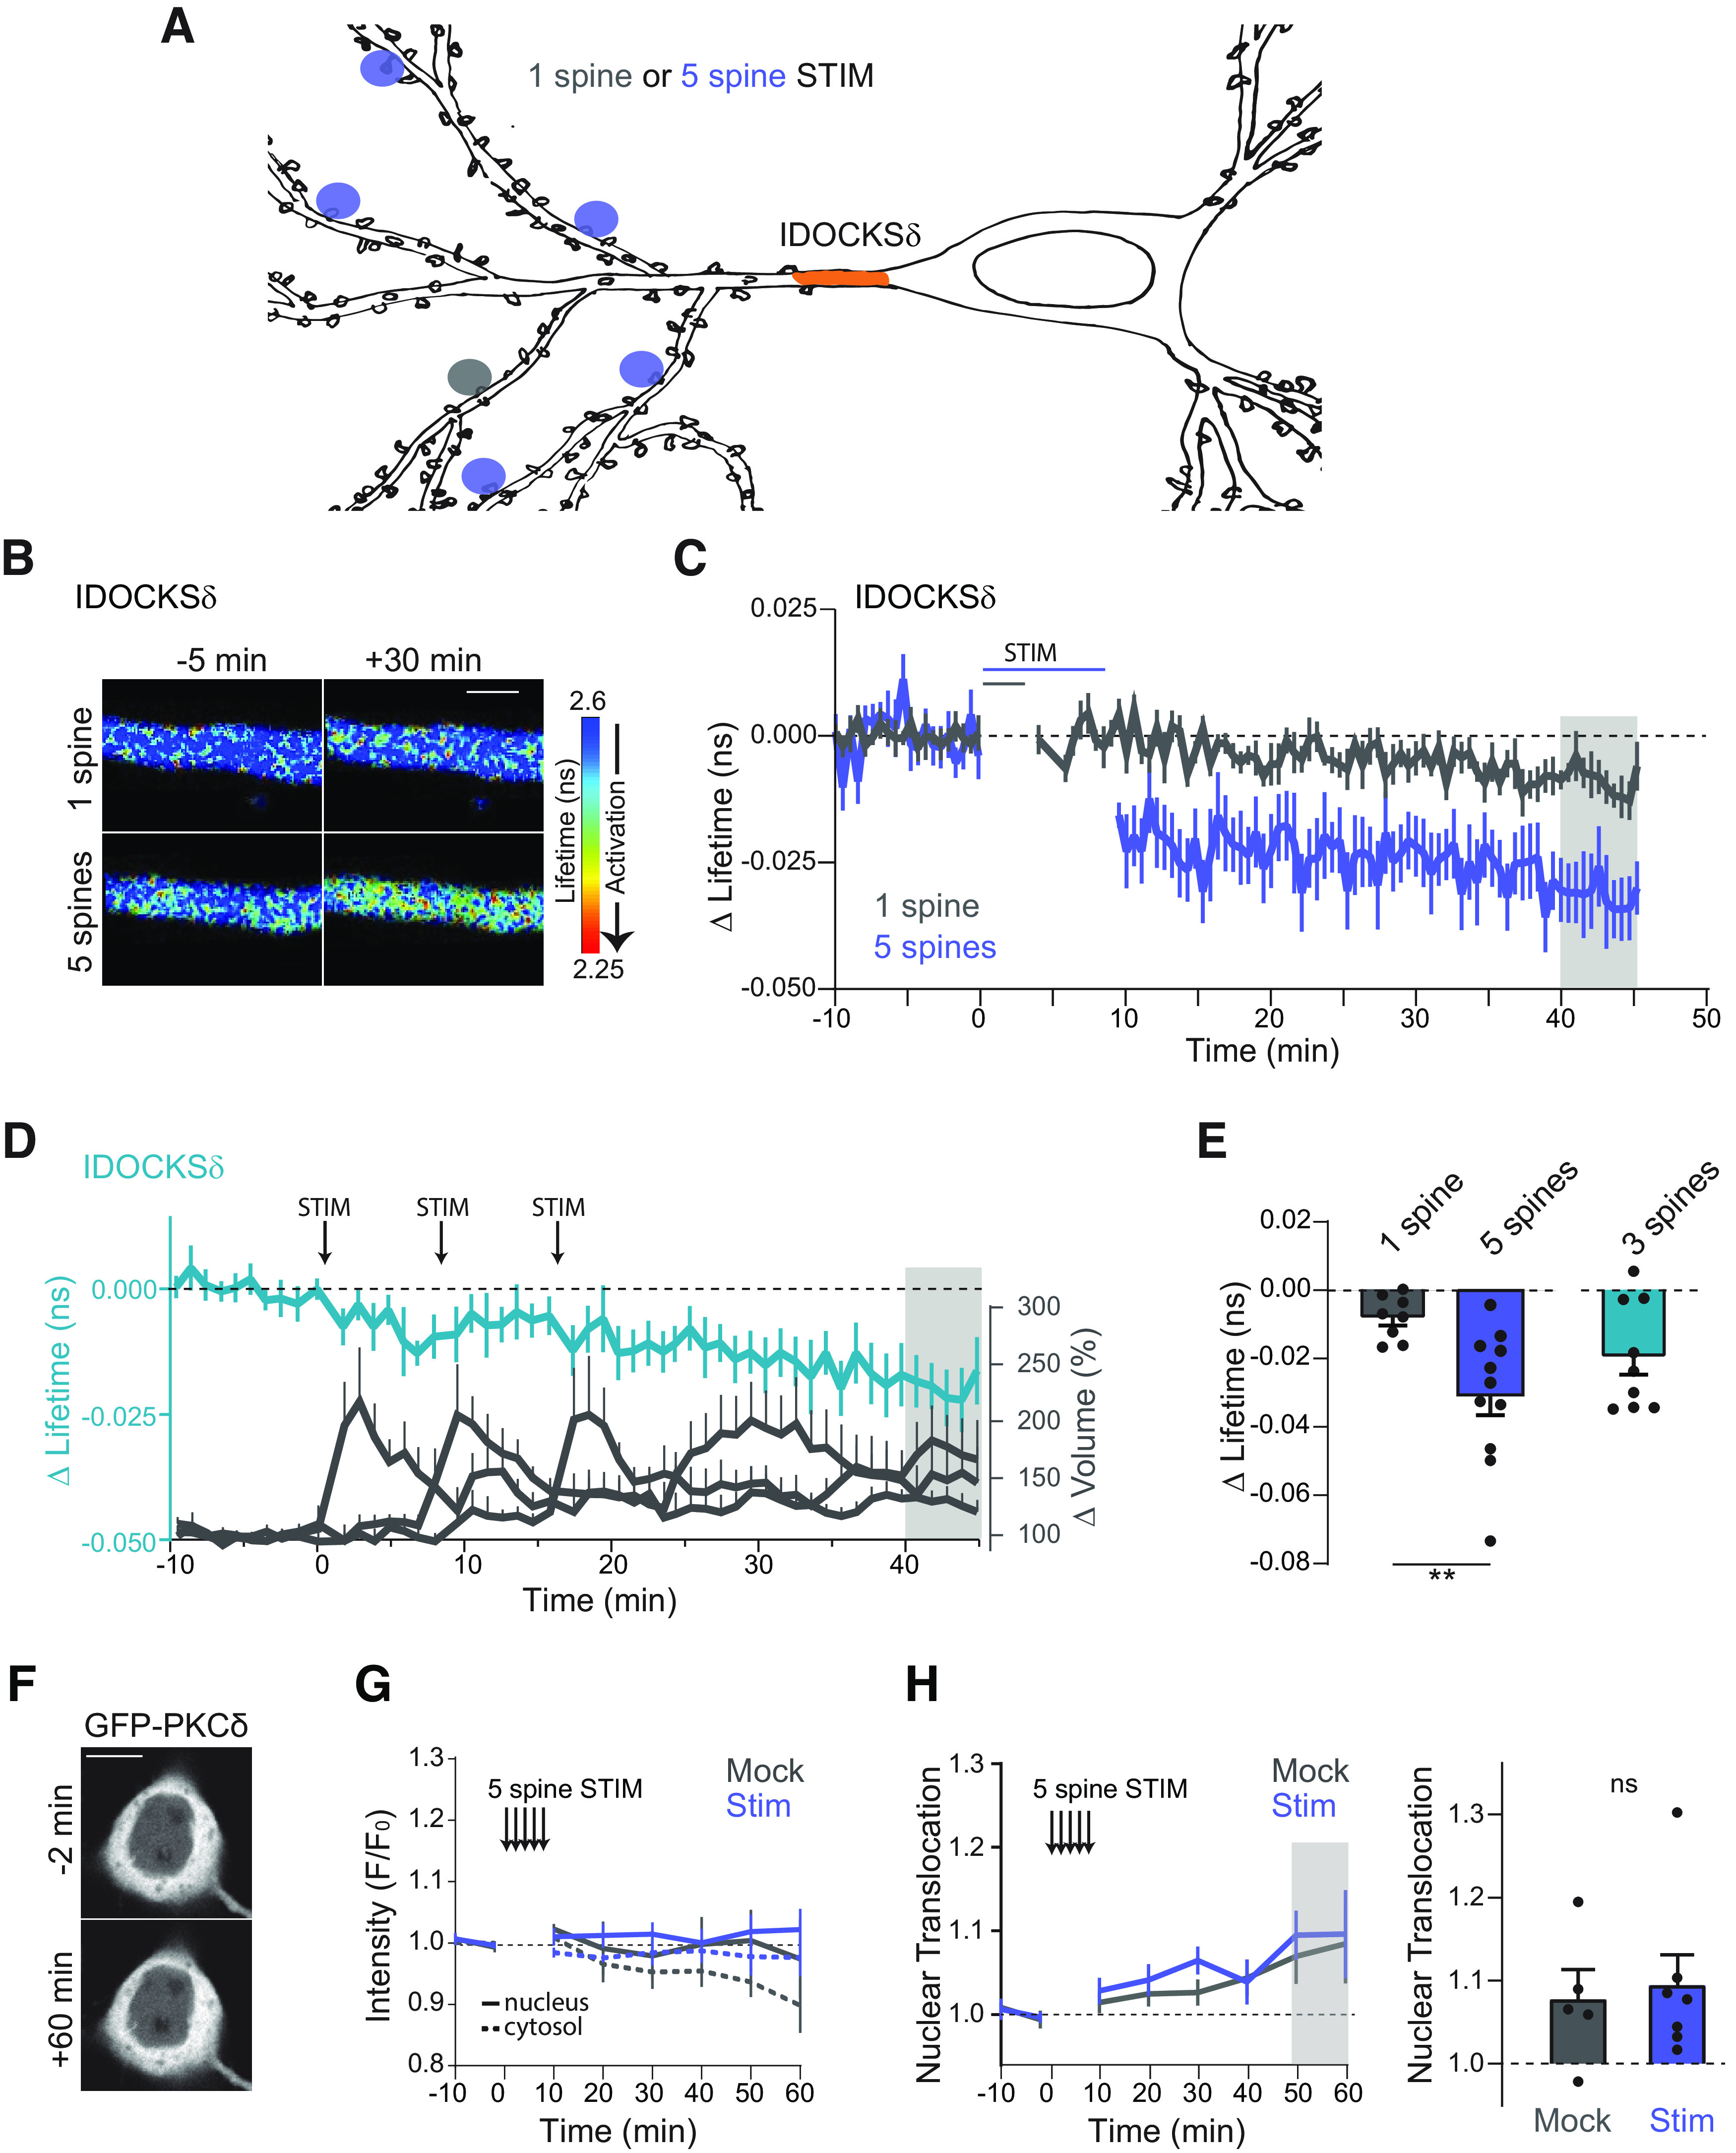
Figure 6.

Multispine stimulation enhances long-lasting and spreading activation of PKCδ. A, Schematic of 1 spine or 5 spine stimulation protocol. Orange area represents the region where PKCδ activation was measured (primary dendrite). B, Representative lifetime images of IDOCKSδ in the primary dendrite in response to 1 or 5 spine stimulation. Warmer colors represent decreased lifetime and activation of PKCδ. Scale bar, 2 μm. C, Time course of PKCδ activity measured by the change in the lifetime of IDOCKS in response to induction of single spine sLTP (n (neurons) = 8) or sequential induction of sLTP in 5 spines (n = 13). D, Time course of PKCδ activation in the primary dendrite (left axis) during the spaced induction of 3 spines. Right axis, The change in the volume of stimulated spines. n (neurons) = 9. E, Quantification of mean change in the lifetime at 40-45 min (gray area in B) for 1, 5, or 3 spine stimulation (n = 9). **p = 0.0065 (two-tailed unpaired t test). F, Intensity images of GFP-PKCδ in hippocampal CA1 neurons before and 60 min after 5 spine stimulation. Scale bar, 10 μm. G, Time course of somatic cytosol and nuclear intensity (F/Fo) of GFP-PKCδ before and after 5 spine stimulation (Stim) or stimulation in the absence of caged Glu (Mock). H, Time course and quantification of nuclear translocation (Nuc intensity/Cytosol intensity). Gray shading represents the time of quantification. ns, p = 0.75 (unpaired two-tailed t test).
