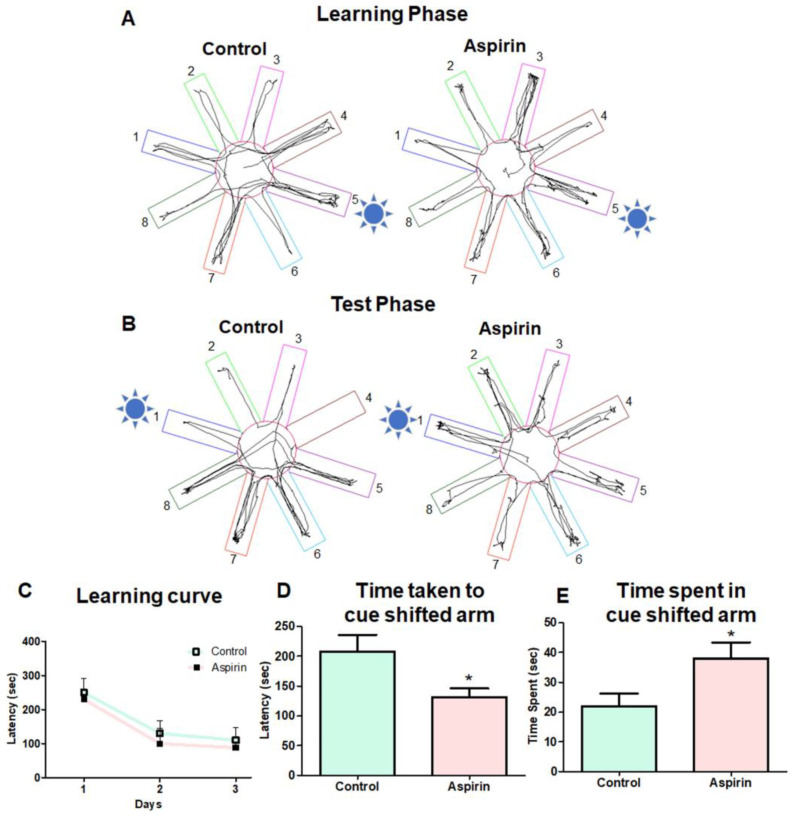
Figure 4.
Cued radial arm maze test. (A) Representative tracking image of cued RAM at the learning phase. The numbers 1 to 8 in the figure denotes order of the arms in the RAM. The sun symbol represents the proximal cue in arm 5 in which rewards were placed in the learning phase. (B) Representative tracking image of cued RAM at the test phase, where the sun symbol represents the proximal cue in which the cue was replaced in arm 1 and the food was removed in the test phase. (C) Result of the learning curve with latency to reach the arm in which cue and food were placed (Day 1: p-value = 0.3528, df = 46, F = 6.709) Day 2: p-value = 0.3048, df = 46, F = 1.381); Day 3: p-value = 0.2752, df = 46, F = 4.973). (D) The bar graph represents the time taken to reach the cue-shifted arm by the animals in the test phase (* p-value = 0.0396, df = 10, F = 3.670 ). (E) The bar graph describes the time spent in the cue-shifted arm by the animals in the test phase (* p-value = 0.0417, df = 10, F = 1.617).

