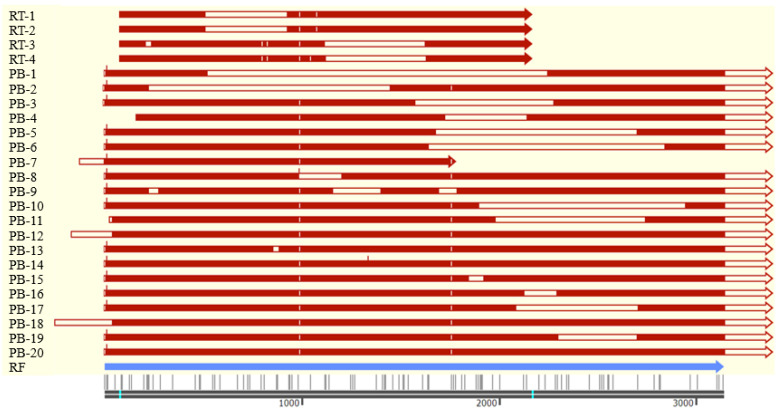
Figure 5.
Schematic structure of transcript variants identified. RT, transcripts identified with RT-PCR method; PB, transcripts identified with PacBio sequencing; RF, reference sequence (GenBank No. NM_001167629.2). Open boxes indicate that there are deletions compared with the RF sequence. The red vertical lines indicate sequence insertion, while white vertical lines indicate single base substitution. The bright blue lines indicate the initiation and termination codon of RF sequence, respectively.

