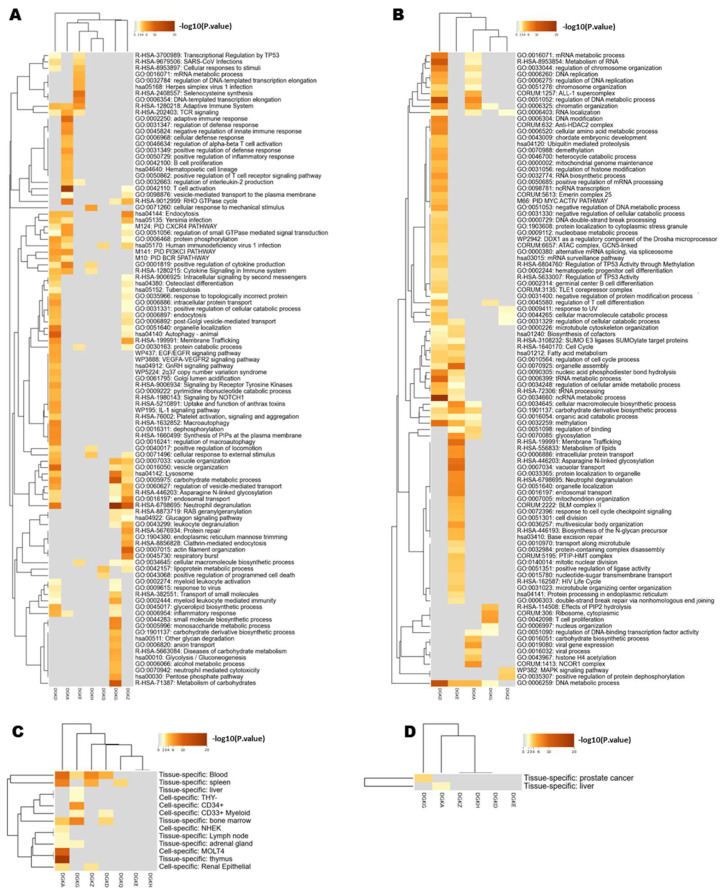
Figure 3.
Analysis of DGK co-expressed genes in the BeatAML database. (A) Heatmap representing the hierarchical clustering of the top enriched pathways obtained by Metascape, using as input the set of genes positively correlated (q-value < 0.05; Spearman’s correlation > 0.40) with the DGK isoforms (columns), according to cBioPortal data. Each row represents a functional cluster. (B) Heatmap representing the hierarchical clustering of the top enriched pathways obtained by Metascape, using as input the set of genes negatively correlated (q-value < 0.05; Spearman’s correlation < −0.40) with the DGK isoforms (columns), according to cBioPortal data. Each row represents a functional cluster. (C) Heatmap of PaGenBase enrichment for genes co-expressed with DGK isoforms from Metascape, obtained giving as input the genes positively correlated with the DGK isoforms (q-value < 0.05; Spearman’s correlation > 0.40). Each row represents tissues and cell types. (D) Heatmap of PaGenBase enrichment for genes co-expressed with DGKs from Metascape, obtained by giving as input the genes negatively correlated with the DGK isoforms (q-value < 0.05; Spearman’s correlation < −0.40). Each row represents tissues and cell types.

