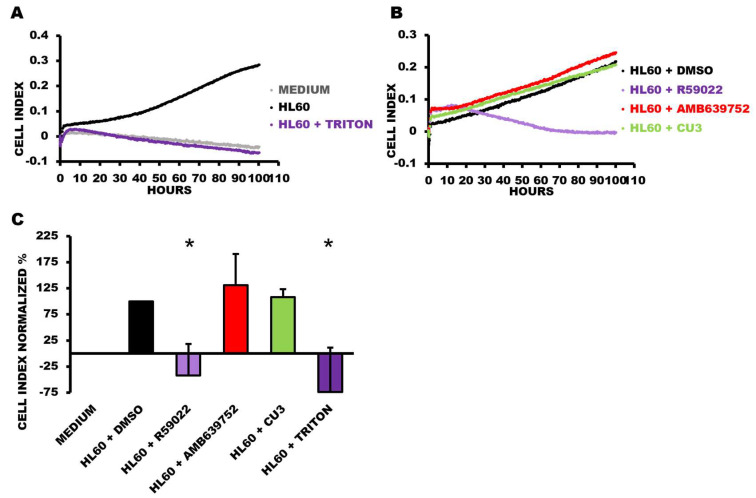
Figure 5.
Viability time course of HL-60 cells treated with DGKA inhibitors. HL-60 cells were plated in the presence or absence of the indicated treatments at a concentration of 50 µM and followed for 100 h. Data are presented as an impedance trend over time. Representative experiment showing (A) control conditions and (B) the treated samples. (C) The graph represents the mean of four independent experiments at 91 h. The data were normalized to the respective control (HL60 + DMSO) and shown as the mean ± SD of the percentage. * p < 0.05, t-test vs. HL60 + DMSO.

