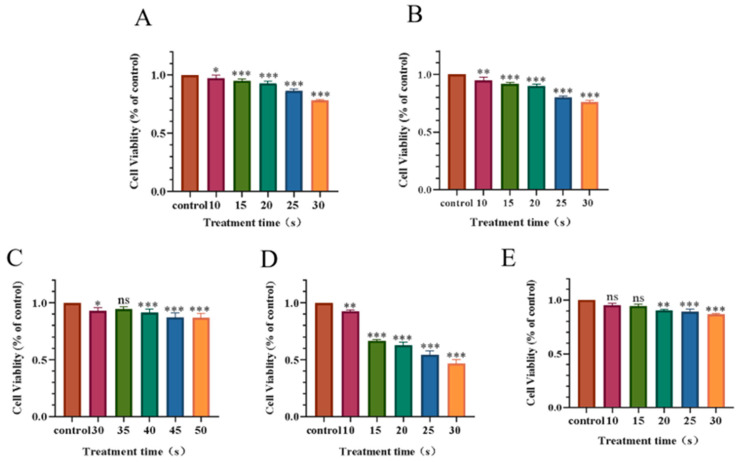
Figure 2.
Effect of PAM with different treatment time on NSCLC cell viability after incubation for 24 h. (A) Cell viability of H460. (B) Cell viability of PC-9. (C) Cell viability of A549. (D) Cell viability of H1299. (E) Cell viability of H1975. Data represent the mean ± SD of three independent experiments. “ns” means no statistical difference. * p < 0.05, ** p < 0.01,*** p < 0.001 with ANOVA compared with the control.

