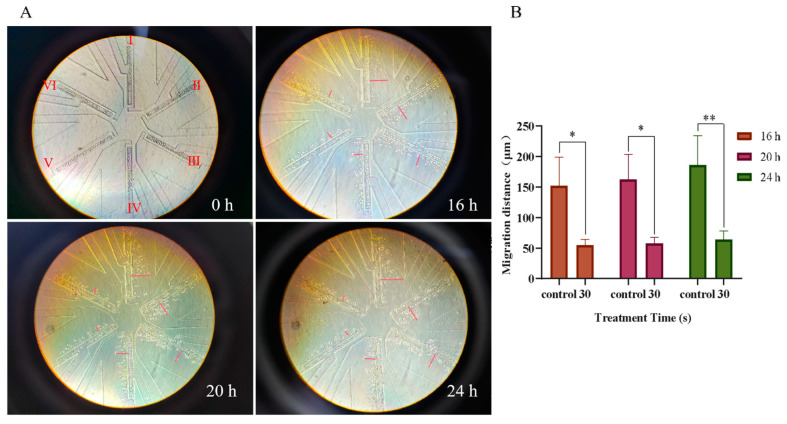
Figure 4.
Observation of the effects of PAM treatment on PC-9 cell migration using high throughput microarray. (A) The migration of PC-9 cells on the chip was recorded at regular intervals, and the migration locations of cells on the chip at 0 h, 16 h, 20 h, and 24 h were recorded. The Ⅰ, Ⅱ, and Ⅲ channels were used as the control group, and the Ⅳ, Ⅴ, and Ⅵ channels were used as the LTP (30 s) treatment group. The auxiliary red line in the figure represents the straight-line distance of PC-9 cell migration. (B) Quantification of the migration distance of PC-9 cells incubated at different times after 30 s PAM treatment. Data represent the mean ± SD of three independent experiments. * p < 0.05, ** p < 0.01 with ANOVA compared with the control.

