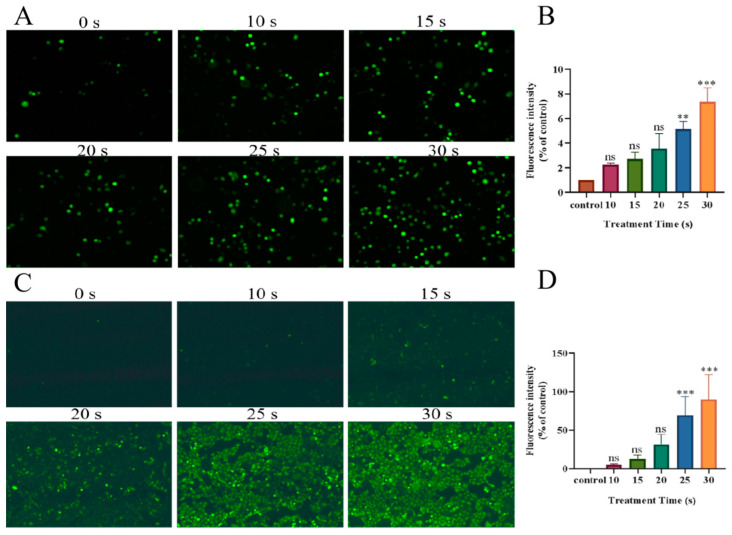
Figure 6.
After PAM treatment, green fluorescence represents the level of ROS in H460 cells and PC-9 cells. (A) Fluorescence image of ROS level in H460 cells after PAM treatment. (B) H460 cells’ intracellular fluorescence level quantification. (C) Fluorescence image of ROS level in PC-9 cells after PAM treatment. (D) PC-9 cells’ intracellular fluorescence level quantification. In (B,D), brown bars, red bars, yellow-green bars, green bars, blue bars and yellow bars represent the control group, 10 s PAM treatment group, 15 s PAM treatment group, 20 s PAM treatment group, 25 s PAM treatment group and 30 s PAM treatment group. Data represent the mean ± SD of three independent experiments. “ns” means no statistical difference. ** p < 0.01,*** p < 0.001 with ANOVA compared with the control.

