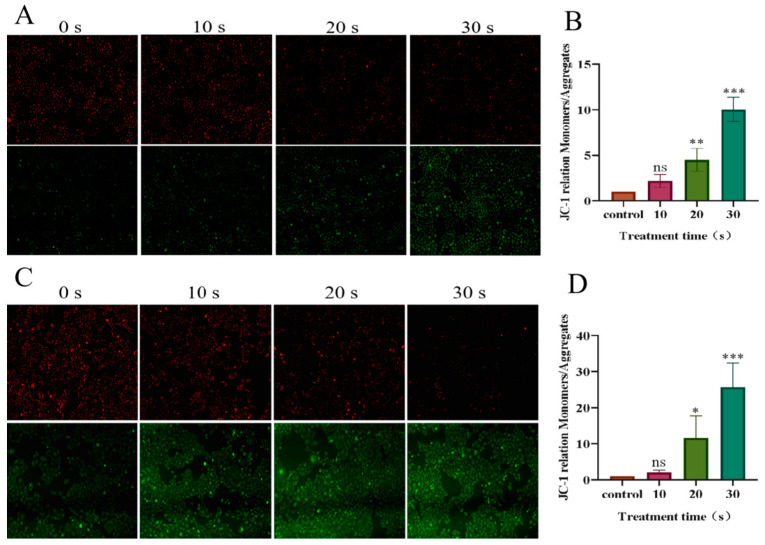
Figure 8.
Effect of PAM treatment on mitochondrial membrane potential in PC-9 and H460 cells. JC-1 forms aggregates with red fluorescence (in healthy mitochondria). With the decrease of membrane potential, JC-1 became a monomer and showed green fluorescence.(A) Fluorescence image of mitochondrial membrane potential in H460 cells after PAM treatment. (B) Fluorescence quantification of mitochondrial membrane potential in H460 cells after PAM treatment. (C) Fluorescence image of mitochondrial membrane potential in PC-9 cells after PAM treatment. (D) Fluorescence quantification of mitochondrial membrane potential in PC-9 cells after PAM treatment. Data represent the mean ± SD of three independent experiments. “ns” means no statistical difference. * p < 0.05, ** p < 0.01, *** p < 0.001 with ANOVA compared with the control.

