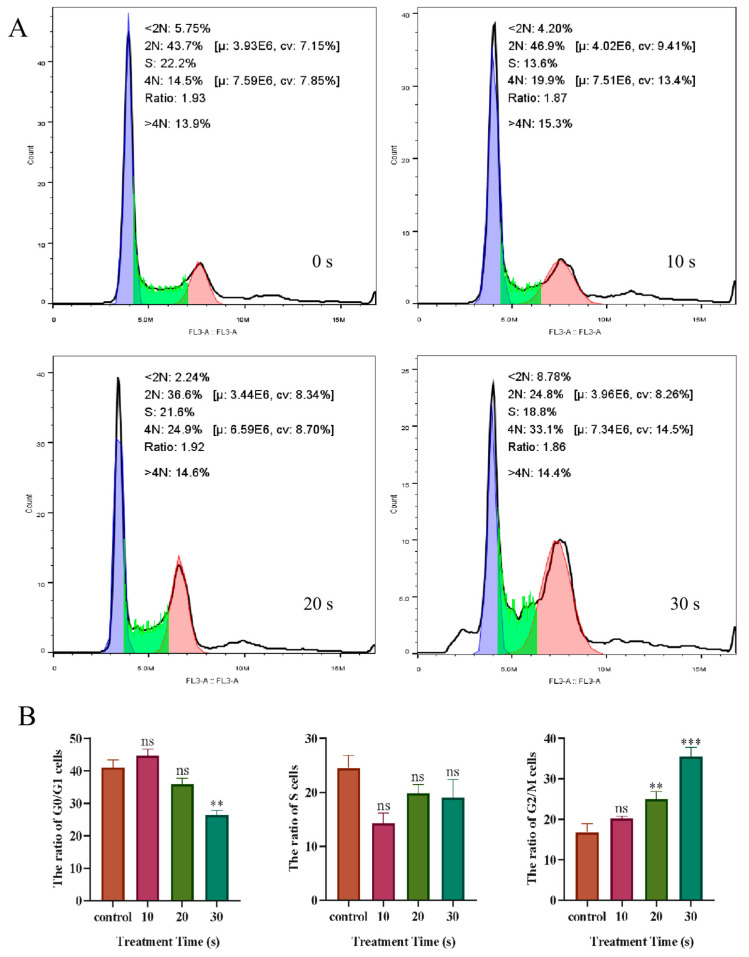
Figure 9.
The effect of LTP treatment on the PC-9 cell cycle. (A) Flow cytometry was used to analyze the cycle distribution of LTP-treated PC-9 cells. Among them, the purple region represents G0/G1 phase, the green region represents S phase and the red region represents G2/M phase. (B) Quantitation of the percentage of cells in the G0/G1, S, and G2/M periods after LTP treatment. Data represent the mean ± SD of three independent experiments. “ns” means no statistical difference. ** p < 0.01, *** p < 0.001 with ANOVA compared with the control.

