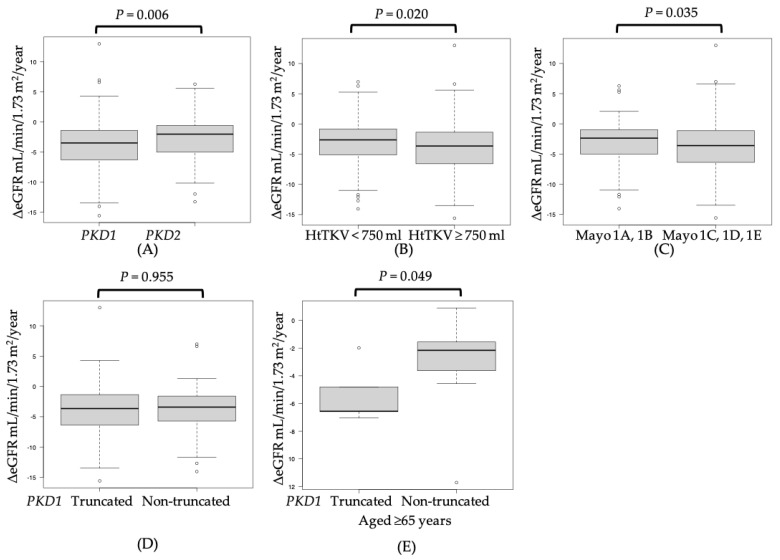
Figure 2.
Mann−Whitney analysis of the clinically important factors related to the rate of change in ΔeGFR performed in the subgroup analysis and comparison of ΔeGFR between patients with PKD1 and PKD2 (A), HtTKV (B), Mayo 1A and 1B and 1C, 1D, and 1E (C), PKD1 truncated or non-truncated mutations (D), and PKD1 truncated or non-truncated mutations in the population aged ≥65 years (E). HtTKV: height-adjusted total kidney volume (mL/m), eGFR: estimated glomerular filtration rate, ΔeGFR/year: represents the 1-year change in eGFR calculated using the least-squares method based on the change in eGFR values before tolvaptan treatment, aged ≥65 years: population aged ≥65 years.

