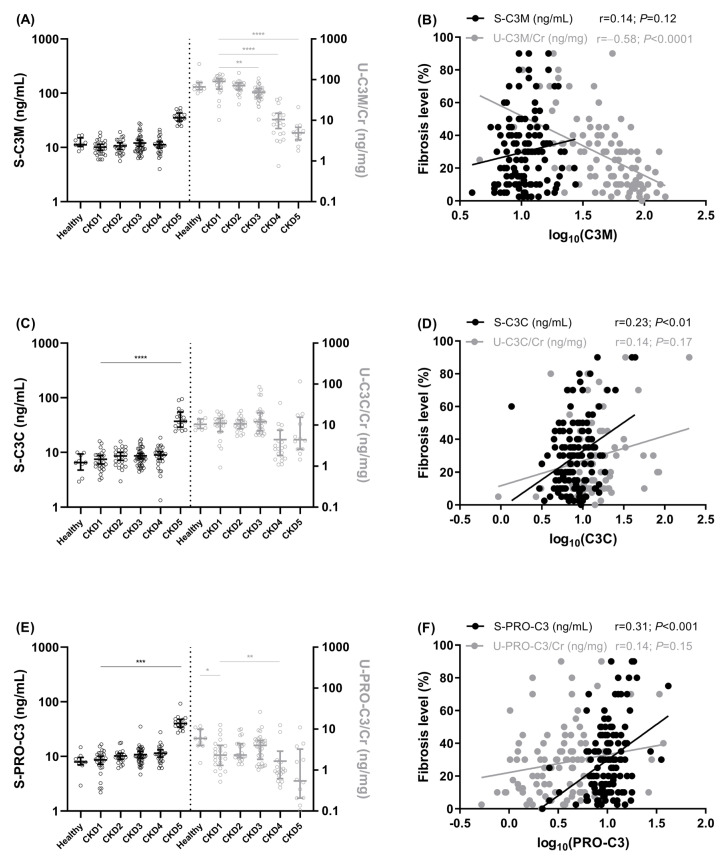
Figure 1.
Collagen type III biomarker levels according to CKD stages and correlation with fibrosis levels. Serum and urinary levels of C3M (A), C3C (C), and PRO-C3 (E) in IgAN patients according to CKD stages (CKD1–CKD5) and in healthy controls (median with IQR and statistical differences were assessed via the Kruskal–Wallis test; * p < 0.05, ** p < 0.01, *** p < 0.001, **** p < 0.0001). Spearman’s rank correlations of serum and urinary levels of C3M (B), C3C (D), and PRO-C3 (F) in IgAN patients. Biomarker levels are presented on a log10-scale. Black symbols corresponds to black y-axis (left, ex S-PRO-C3) and grey right y-axis (ex U-PRO-C3/Cr) and the figures are divided by a dotted line in the middle.

