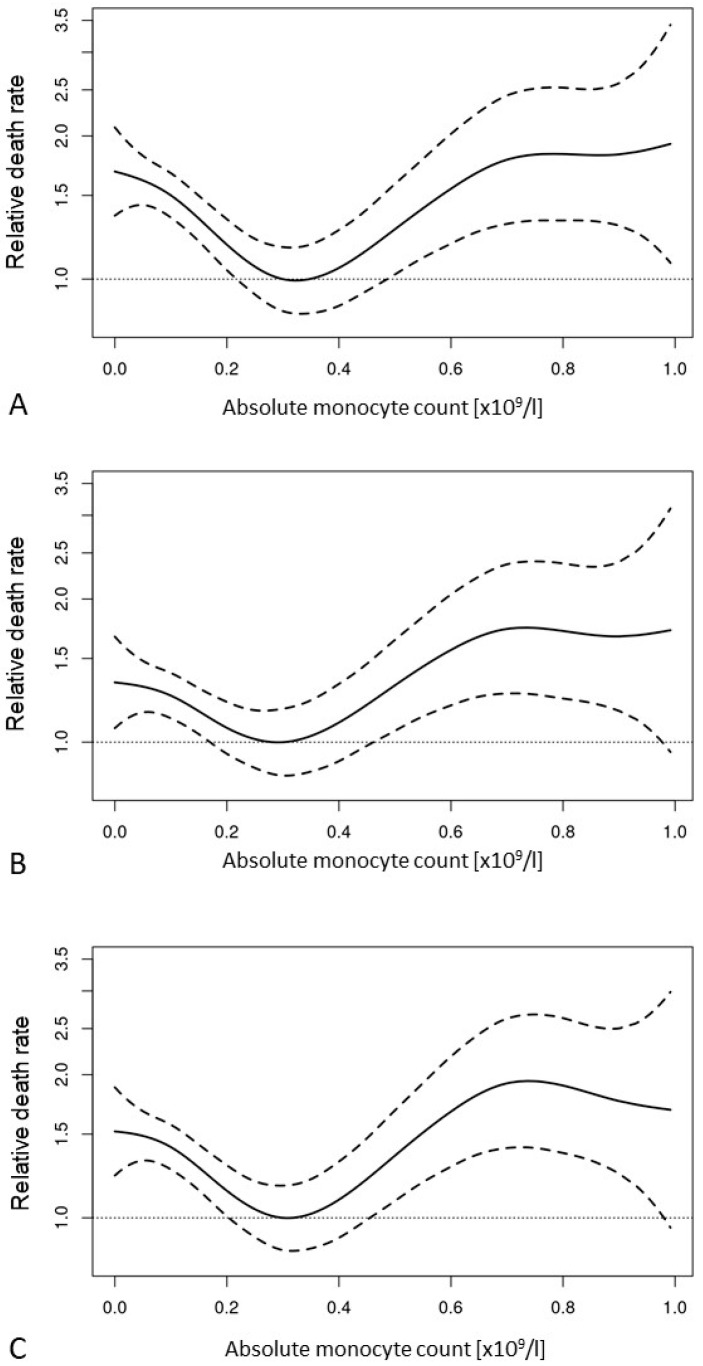
Figure 3.
P-splines modelling the prognostic impact of the absolute monocyte count in a univariate proportional hazards model (A) and two multivariate proportional hazards models together with the single factors of the IPSS-R (B), see also Table 4, row 2 or the single IPSS-R risk groups (C), see also Table 4, row 3.

